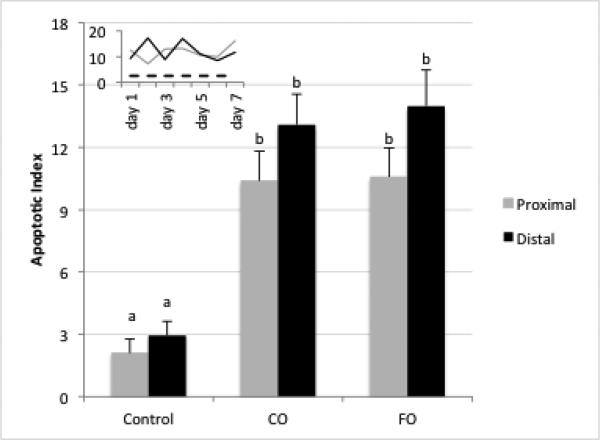
Figure 3.
Apoptotic index during recovery from DSS treatment. Data represent average apoptotic index within diet groups over the 7 d DSS recovery period (all days combined). At least 20 crypts each from n=3 mice per diet group and time point were scored for TUNEL positive (apoptotic) cells and expressed as apoptotic index (number of apoptotic cells per 100 crypts). Bars with different letters are statistically different (p<0.05). Inset: Apoptosis on individual days in proximal (grey) and distal (black) colon for both diets combined. Dotted line: untreated control mice.

