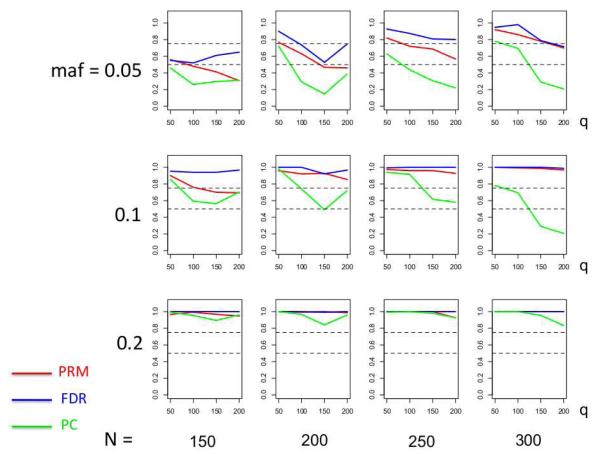
Fig. 6.
The power comparison results of the PRM, CWM, and PCR methods for multiple SNP effects based on different sample sizes (150, 200, 250 and 300) and different minor allele frequencies (0.05, 0.1 and 0.2). The horizontal axis of each plot is the number of phenotypes q and the vertical axis is the power. The upper and lower dashed lines represent the powers of 75% and 50%, respectively.

