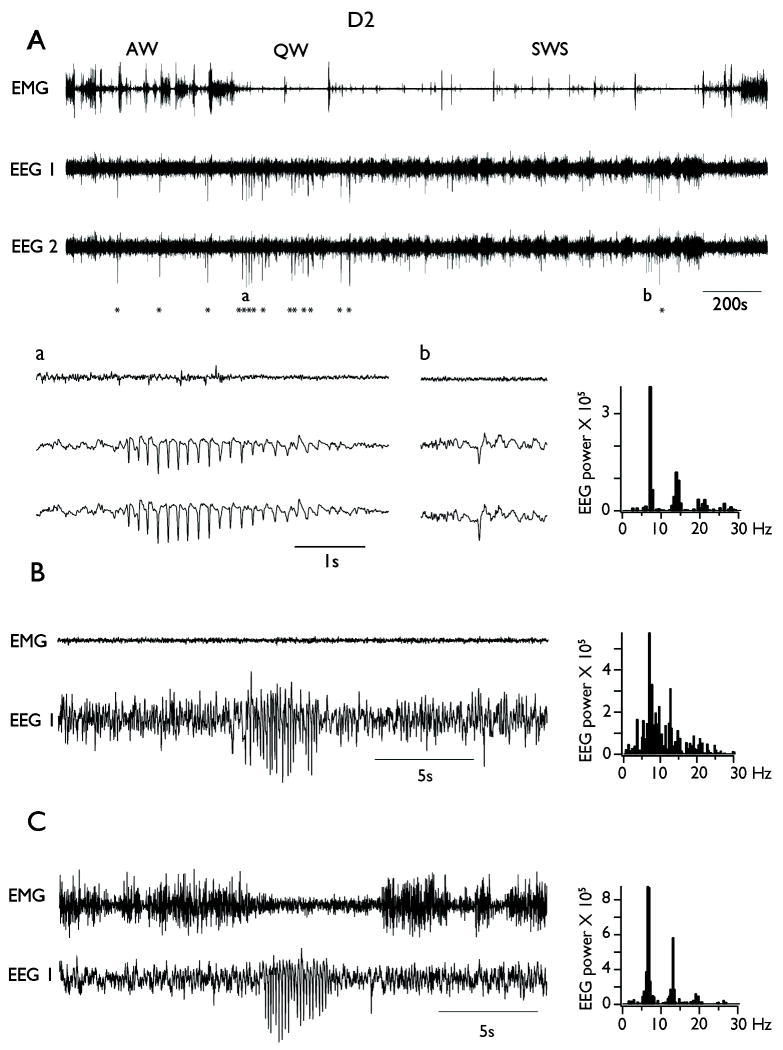
Figure 2. Spike Wave Discharges (SWDs) occurrence in freely behaving D2 mice.
A. Upper panel shows a representative continuous bilateral EEG recording from a D2 mouse alongside with EMG recording. The stars indicate the occurrence of SWDs. Note the increase in the occurrence of SWDs during quiet wakefulness (QW) compared to active waking (AW) and slow wave sleep (SWS). Detail a: typical example of SWDs during QW. Detail b: typical example of isolated large amplitude single spike during SWS. B. Example of SWDs occurring during SWS. C. Example of SWDs occurring during AW. Note the decrease in EMG amplitude during SWDs. On the right are displayed the power spectra computed during the seizure episodes on the EEG traces situated on the left.

