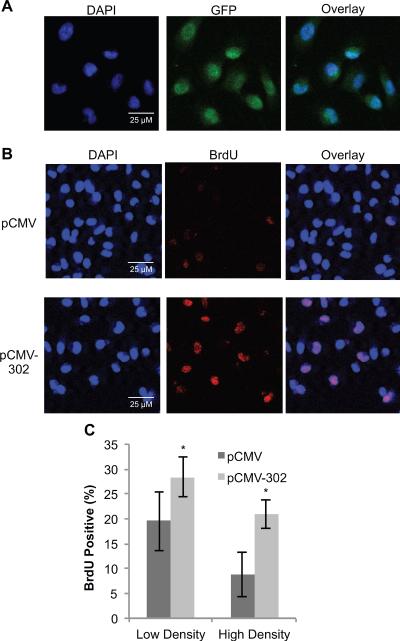
Figure 5. miR-302 overexpression increases the percentage of BrdU-positive cells.
MB-231 cells were transfected with pCMV or pCMV-302. (A) Transfected monolayers were immunostained for GFP followed by counterstaining with DAPI. Representative microscopy images of nuclei (DAPI), GFP, and overlay images are shown. Transfection efficiency was calculated by counting the percentage of GFP-positive cells. (B) Representative microscopy images of nuclei (DAPI) and BrdU-positive cells in pCMV (top) and pCMV-302 (bottom) transfected cells. (C) ImageJ software was used to calculate the percentage of BrdU-positive cells in pCMV and pCMV-302 transfected low and high cell density cultures. Five hundred cells were counted in low cell density cultures, and 2000 cells were counted in high cell density cultures, over a 4mm × 4mm field. n = 3, error bars represent standard deviation.

