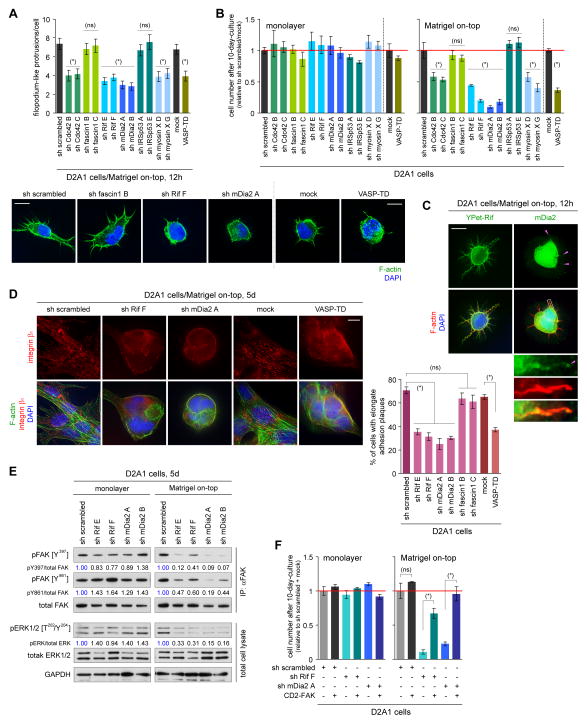
Figure 5. Identification of the molecular regulators of FLP formation.
(A,B) Screening of filopodium regulators for their involvement in FLP formation and proliferation. D2A1 cells, manipulated to block the expression or function of filopodium-associated proteins, were tested for FLP formation under MoT culture conditions (A). Two different shRNA sequences were tested for each knockdown targets. The effects of these manipulations on the cell number after 10 days of monolayer or MoT cultures were also tested (B). (ns) p > 0.2, (*) p < 0.02 (vs control).
(C) Localization of Rif and mDia2 to FLPs. YPet-Rif fusion protein was used for analyzing Rif distribution, whereas mDia2 localization was determined by direct immunostaining (green; mDia2 localization at FLP tips is indicated by pink arrowheads). F-actin (red) and nuclei (blue) were also visualized.
(D) Role of Rif/mDia2 signaling and Ena/VASP proteins in adhesion plaque formation. Some of the engineered D2A1 cells described in A were cultured under MoT conditions. The presence of integrin β1-containing, elongated adhesion plaques was quantified (right). (ns) p > 0.05, (*) p < 0.0005.
(E) Role of Rif/mDia2 signaling in FAK/ERK activation. Lysates from the indicated cell types were immunoprecipitated with an anti-total FAK antibody and analyzed for FAK phosphorylation levels. These lysates were also analyzed by direct immunoblotting for ERK phosphorylation levels.
(F) Rescue of proliferation defects by CD2-FAK expression. The control, Rif-knockdown and mDia2-knockdown D2A1 cells were further engineered to express the constitutively active CD2-FAK fusion protein. Cell numbers after 10-day-culture were plotted. (ns) p > 0.1, (*) p < 0.005.
Bars = 10 μm. Values = means ± SEM (n = 100; A) or means ± SD (n = 3; B,D,F).

