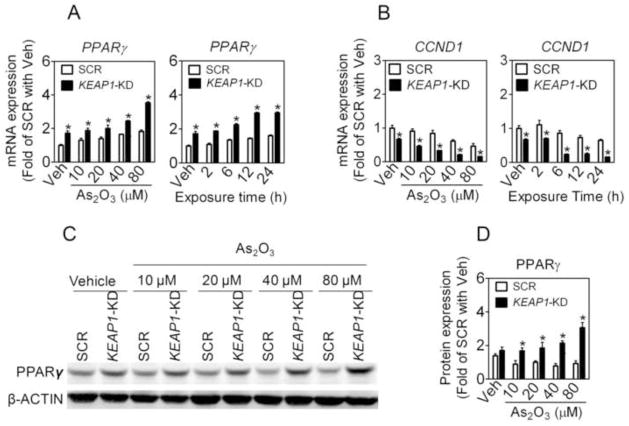
Fig. 7.
Knockdown of KEAP1 in A549 cells augments the expression of PPARγ under basal and As2O3-treated conditions. (A) mRNA expression of PPARγ. Cells were treated with As2O3 for 6 h at indicated concentrations (left panel) or 40 μM of As2O3 for indicated time (right panel). *, p < 0.05 vs SCR with the same treatment. (B) KEAP1-KD cells show reduced mRNA expression of CCND1 in response to As2O3 treatment. Cells were treated as (A). (C) Protein level of PPARγ. Cells were treated with As2O3 for 6 h at indicated concentrations. (D) Quantification of (C). n = 3; *p < 0.05 vs. SCR.

