
Figure 1.
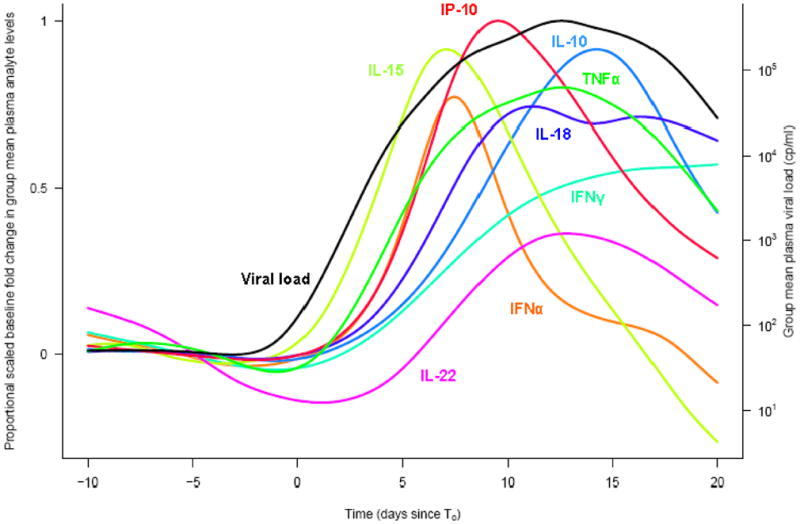
The proportional fold-change relative to baseline in plasma levels of selected analytes and viral load in 35 plasma donors with acute HIV infection is shown. Time is plotted in days relative to T0, the day of first detectable plasma HIV.
Figure reused with permission from the Journal of Virology, originally published in [28].