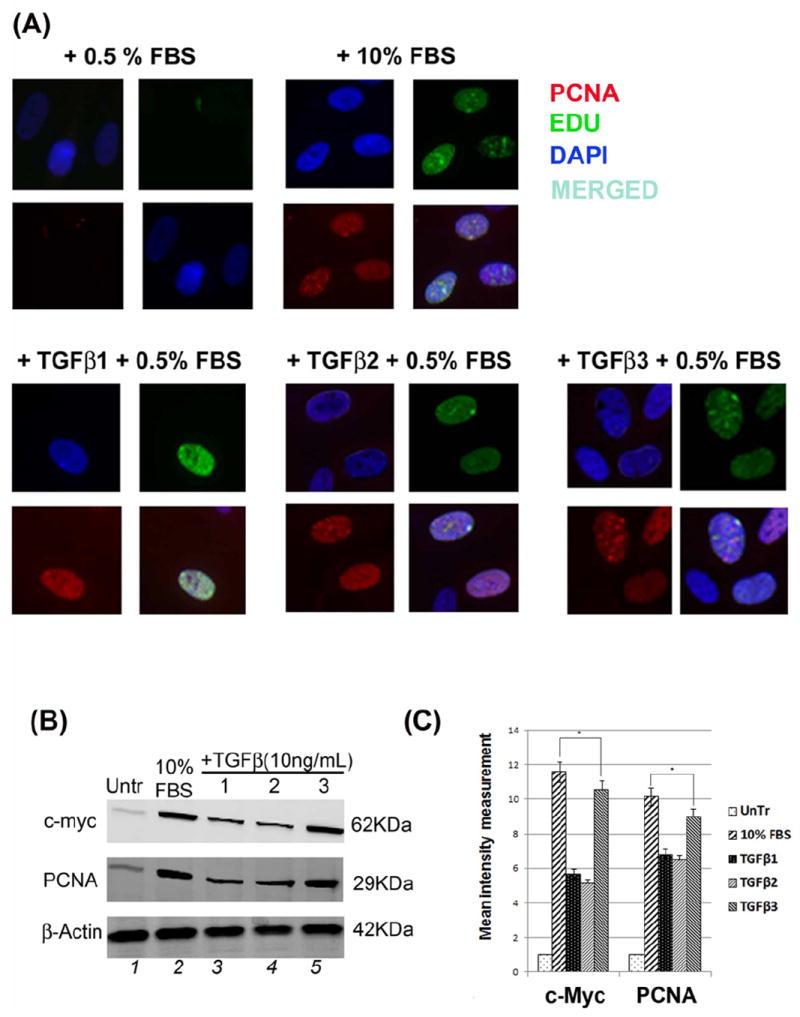
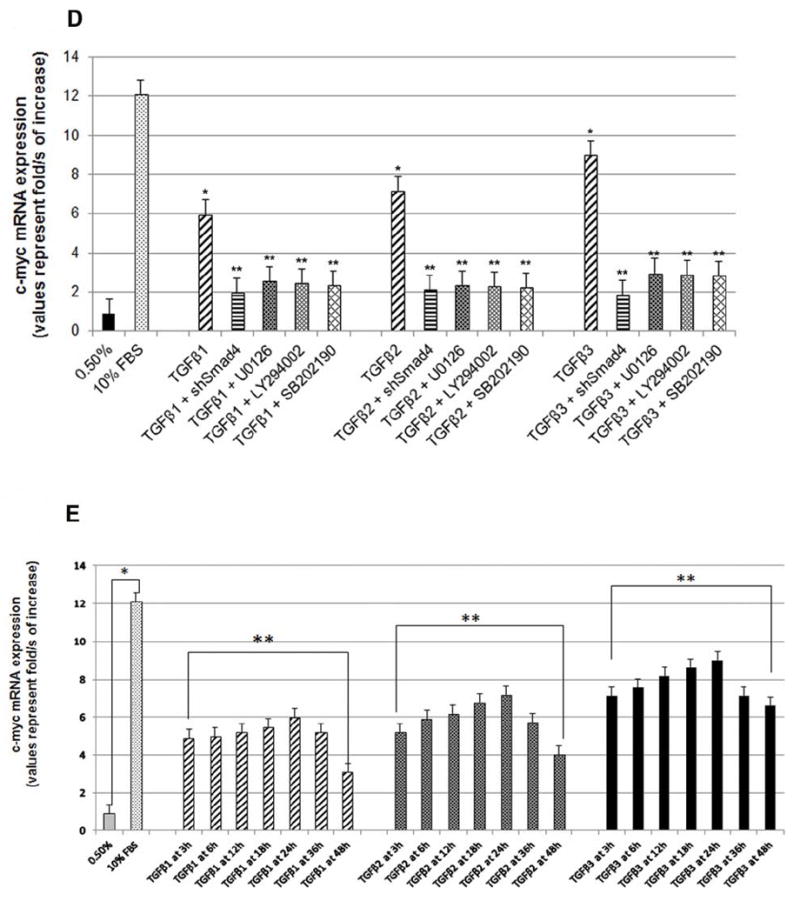
Fig 5. TGFβ enhances HEPM cell proliferation.


(A) HEPM cell proliferation was assessed by EdU and nuclear localization of PCNA as detected by immunofluorescence. 24 h treatment with TGFβ1, 2 and 3 increased the number and the intensity of PCNA (rhodamine, red) and EdU (fluorescence, green) expressing HEPM cells compared to negative control (0.5% FBS). Once merged with DAPI (blue), HEPM cells treated with TGFβ3 showed increased numbers of cells with colocalization of PCNA and EdU in the nucleus when compared to negative control as well as other isoforms of TGFβ. (B) The effect of TGFβ 1, 2 and 3 on the levels of PCNA and c-Myc proteins. Western blot analysis showed an increase in the levels of PCNA and c-Myc proteins in TGFβ treated (24 h) HEPM cells when compared with negative control (0.5% FBS), TGFβ3 having the highest protein expression compared to TGFβ1 and 2 (C) Results from the blots and the intensity of the bands were measured using the Carestream Molecular Imaging Software version 5.3.1 (Rochester, NY). To perform a t-test analysis of mean intensity measurements, a ROI analysis was done from the data to Microsoft Excel software. Data points for all samples are paired by spatial arrangement on gel and compared pairwise to minimize the impact of subtle background artifacts on image analysis. All three TGFβ treatment groups differed significantly from the positive control (10% FBS) groups, (p ≤ 0001, as indicated by *). (D) Regulation of c-Myc mRNA by TGFβ. c-Myc mRNA expression was determined by real-time PCR in TGFβ1, 2 and 3 treated (24h) HEPM cells. TGFβ treated cells had higher c-Myc mRNA expression levels compared to the negative control (0.5% FBS). The change in mRNA levels was determined by comparison to control (0.5% FBS) and plotted as fold change/s (mean ± s.d.; n=3; *P<0.005 compared with controls; **P <0.05 compared with TGFβ treatments with different inhibitors). When compared to control (x0.9), TGFβ1 (x6.63), TGFβ2 (x7.97), and TGFβ3 (x10.01) had higher c-Myc mRNA levels. To establish the pathways TGFβ uses to induce c-Myc mRNA, Smad-dependent pathways were blocked by shRNASmad4 (pRetrosuper-shSmad4) for 24 h and Smad-independent pathways were blocked using commercially available small synthetic chemical inhibitors for 60 minutes: SB202190 (20μM), an inhibitor of ERK1/2; U0126 (20μM), an inhibitor of MEK1/2; and LY294002 (20μM), an inhibitor of PI3 Kinase. Following all inhibitions (pRetrosuper-shSmad4 and chemical inhibitors) TGFβ 1, 2 and 3 (10ng/mL) were added in the presence of these molecules for another 24 h to sustain the effect of inhibition throughout the TGFβ induction phase, after which mRNA was extracted. TGFβ stimulated c-Myc mRNA expression fell more than 50% of its value (compared to uninhibited TGFβ1, 2 and 3 values) when both Smad-dependent and Smad-independent pathways were inhibited. (E) Regulation of c-Myc mRNA by TGFβ in time dependent fashion. c-Myc mRNA expression was determined by real-time PCR in TGFβ1, 2 and 3 treated (3, 6, 12, 18, 24, 36 and 48 h) HEPM cells. TGFβ treated cells had higher c-Myc mRNA expression levels compared to the negative control (0.5% FBS). The change in mRNA levels was determined by comparison to control (0.5% FBS) and plotted as fold change/s (mean ± s.d.; n=3; *P<0.005 compared with controls; **P <0.05 compared with TGFβ treatments. When compared to control (x0.9), TGFβ1 (x6.63), TGFβ2 (x7.97), and TGFβ3 (x10.01) had higher c-Myc mRNA levels and the trend shows that the c-Myc mRNA expression remain stable and reach a peak at 24 h after which the expression decreases by 48 h.
