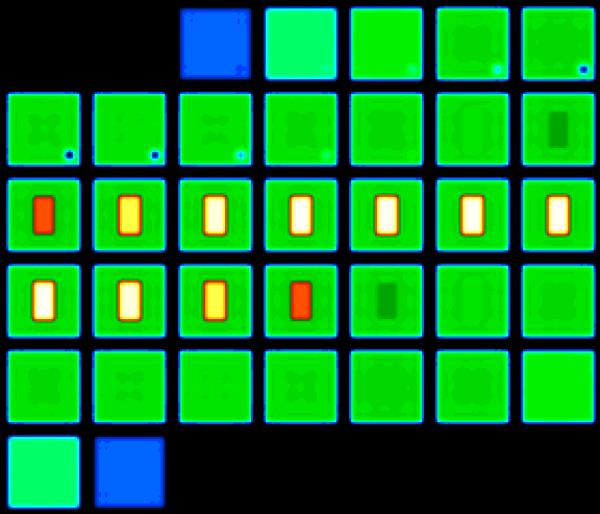
Figure 2.
Simulation phantom (shown reconstructed with a Blackman k-space filter) used to compare the impact of applying the ideal transform in image-space and k-space. The phantom was simulated to have sodium characteristics matching brain parenchyma (38 mM concentration, biexponential relaxation: 60% T2=2.5 ms, 40% T2=14ms, green) and CSF (144 mM concentration, T2=55 ms, white). The small signal void that appears as low concentration (blue) removed any orientation ambiguity. Thirty-five axial partitions are shown. The color scale (right) is the sodium concentration in mM.

