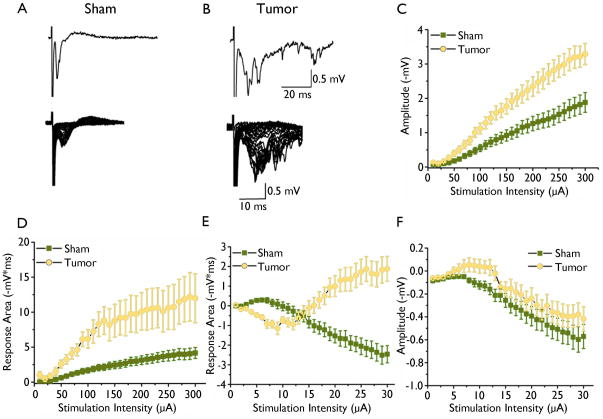
Figure 2.
Extracellular field recording in sham-operated and tumor-bearing slices. Representative traces of field recordings from sham-operated (A) and tumor-bearing (B) slices in response to increasing stimulation intensities. Upper trace in (A) shows individual trace from sham and from tumor slices in (B) in response to half maximal stimulation intensity. Graphical display of input/output curves of fPSPs recorded in superficial cortical layer II/III of the excitatory response amplitude (C) and excitatory response area (D) as a function of stimulation intensity in sham-operated (squares) compared to tumor-bearing slices (circles). Tumor-bearing slices showed significantly larger amplitude (p < 0.01) and area (p < 0.01) of the “early” excitatory component. Input/output curve of the “late” inhibitory response area (E) amplitude (F).

