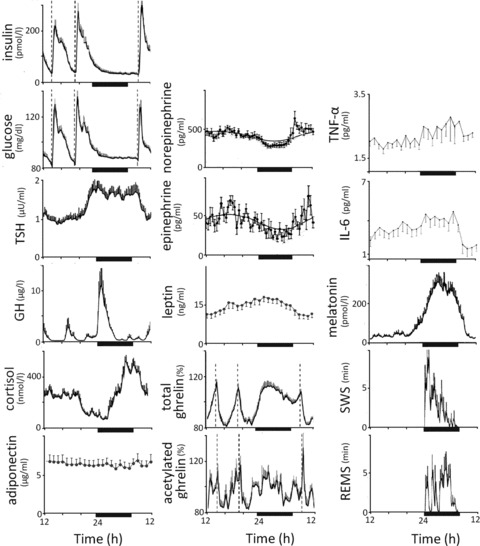
Figure 2.

Mean levels of metabolic parameters and sleep stages in lean young men (n = 8 for TSH, cortisol, GH, melatonin, SWS, and REM sleep;48n = 14 for insulin, glucose, total and acetylated ghrelin;76n = 8 for catecholamines73); in 23 lean women for leptin and adiponectin;69 and in 25 individuals (13 females, 12 males) for IL-6 and TNF-α.83 Ghrelin levels are indicated as a percent of mean 24-h values (1027 pg/mL for total ghrelin; 80 pg/mL for acetylated ghrelin); leptin levels are shown as percent change from levels at 08:00. Dark bars below each plot indicate bedtimes. Sleep was monitored polysomnographically during all measurements. Striped bars indicate meal times. Modified, with permission Refs. 48, 69, 73, 76, and 83
