
Fig. 3.
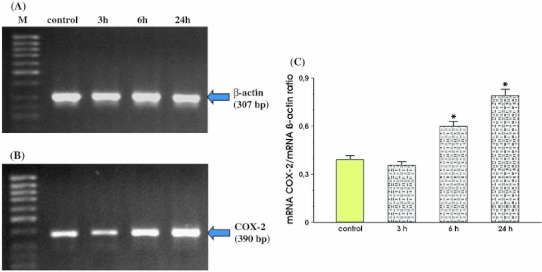
RT-PCR analysis of mRNA expression for COX-2 in the MKN7 cells exposed to Hp expressing cagA and vacA. a and b represent mRNA expression for β-actin and COX-2, respectively. Lane control means control cells (without infection). Following lanes represent mRNA expression for β-actin and COX-2 in MKN7 cells infected with Hp and incubated at 3, 6 and 24 h, respectively. c Represents the ratio of COX-2 mRNA over β-actin mRNA. Results are mean ± SEM of five experiments. Asterisks indicate a significant change (p < 0.05) as compared to control