
Fig. 7.
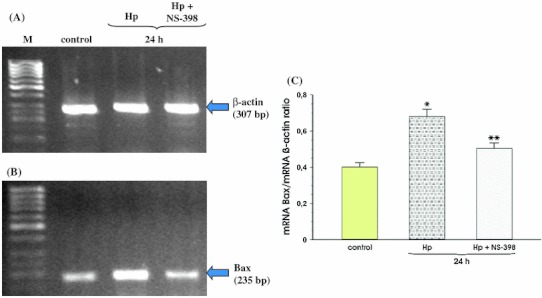
RT-PCR analysis of mRNA expression for Bax in the MKN7 cells exposed to Hp expressing cagA and vacA in the absence and the presence of NS-398. a, b Represent mRNA expression for β-actin and Bax, respectively. Lane control means control cells without Hp infection and NS-398 addition. Following lane represents mRNA expression for β-actin and Bax in MKN7 cells incubated 24 h with Hp and the next lane shows mRNA expression for β-actin and Bax in MKN7 cells incubated 24 h with the combination of Hp and NS-398. c Represents the ratio of Bax mRNA over β-actin mRNA. Results are mean ± SEM of five experiments. Asterisks indicate a significant change (p < 0.05) as compared to control. Double asterisks indicate a significant change (p < 0.05) as compared to MKN7 cell incubation with Hp alone