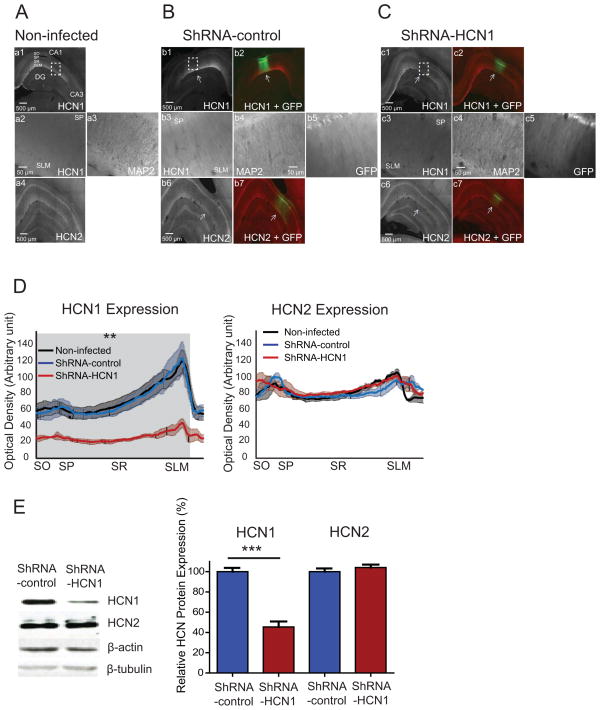
Figure 2. Specific knockdown of HCN1 by lentiviral-shRNA-HCN1 in the CA1 region of the dorsal hippocampus.
(A) 70-μm-thick dorsal hippocampal slices from non-infected rats were immunolabeled with HCN1 (a1, a2), HCN2 (a4), and dendritic marker MAP2 (a3). a2 and a3 are enlarged from the dashed box. (B) In the shRNA-control-infected dorsal hippocampal CA1 region, protein expression of HCN1 (b1, b3), HCN2 (b6), and MAP2 (b4) were similar to non-infected group. b3, b4, and b5 are enlarged from the dashed box. The labeling of HCN1 (b1) and HCN2 protein (b6) were superimposed with GFP expression in b2 and b7. The arrows indicate lentivirus-infected CA1 region. (C) In the ShRNA-HCN1-infected dorsal hippocampal CA1 region, protein expression of HCN1 (c1, c3) was significantly reduced without affecting the expression of HCN2 (c6) and MAP2 (c4). c3, c4, and c5 are enlarged from the dashed box in c1. The labeling of HCN1 (c1) and HCN2 protein (c6) were superimposed with GFP expression in c2 and c7. (D) Quantification of HCN1 and HCN2 protein expression from the perisomatic region to the distal dendritic area in the CA1 region. The gray shade indicates significant difference in HCN1 protein expression between shRNA-HCN1-infected region (n=3) and non-infected (n=3) or shRNA-control-infected regions (n=3) (Unpaired t-test). There was no significant difference in HCN2 protein expression from the perisomatic region to the distal dendritic area in the CA1 region (Unpaired t-test). (E) Western blotting of shRNA-control-infected (n=7) and shRNA-HCN1-infected (n=7) CA1 lysates with antibodies against HCN1, HCN2, β-actin, and β-tubulin. The protein expression of HCN1 and HCN2 were quantified and normalized by β-tubulin. The right displays the summary of HCN1 and HCN2 protein expression in shRNA-control-infected and shRNA-HCN1-infected regions. Data are expressed as mean ± SEM. **p < 0.01, and ***p < 0.001 compared with non-infected or lentiviral-shRNA-control-infected group. SO: Stratum Oriens; SP: Stratum Pyramidale; SR: Stratum Radiatum; SLM: Stratum Lacunosum Moleculare.

