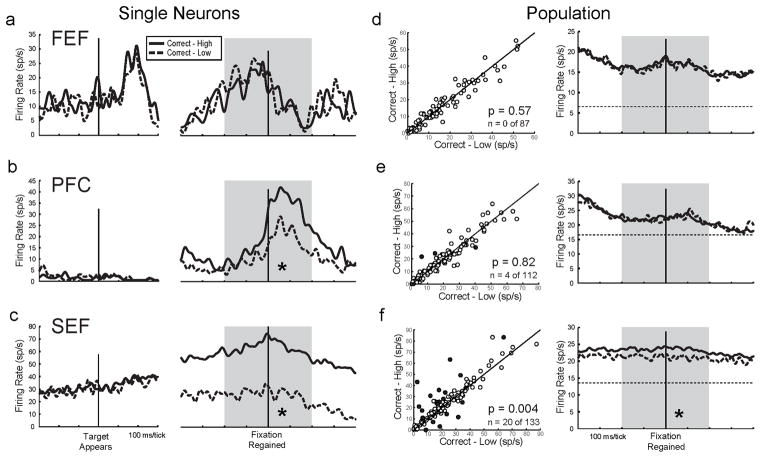
Figure 3.
Metacognition-related activity. For the single neuron examples (a–c), firing rates for all Correct-High (CH) trials (solid lines) and Correct-Low (CL) trials (dashed lines) are aligned to Decision Stage target onset (left) and on regaining fixation to begin the Bet Stage (right). Grey shading indicates the interstage epoch. For the population data (d–f), scatterplots (left) show CH vs. CL firing rates for each neuron during the interstage epoch, p values of t-tests of population CH vs. CL activity, and numbers (n) of individual neurons with significant CH vs. CL activity (each denoted with a filled dot). Activity profiles (right) show population spike density functions, with baseline activity levels (dashed horizontal lines) provided for reference. Asterisks indicate significant differences within the interstage epoch (p < .05 for single neurons and < .025 for population data). The FEF neuron (a) was not significantly different between trial types (post-ANOVA t-test, p > .05), but the PFC neuron (b) and SEF neuron (c) had significantly greater activity in CH than in CL trials (both p < .001). (d) In the FEF, single neurons (left) and population profiles (right) showed no significant differences in activity between CH and CL trials. (e) In the PFC, a few single neurons showed CH vs. CL differences (left), but this was not significant at the population level, and population profiles overlapped (right). (f) In the SEF, many individual neurons showed CH vs. CL differences (left), this was significant at the population level, and population profiles were higher for CH than CL trials throughout the interstage epoch (right). Table 2, Interstage column, shows corresponding numerical data. See also Figure S3.

