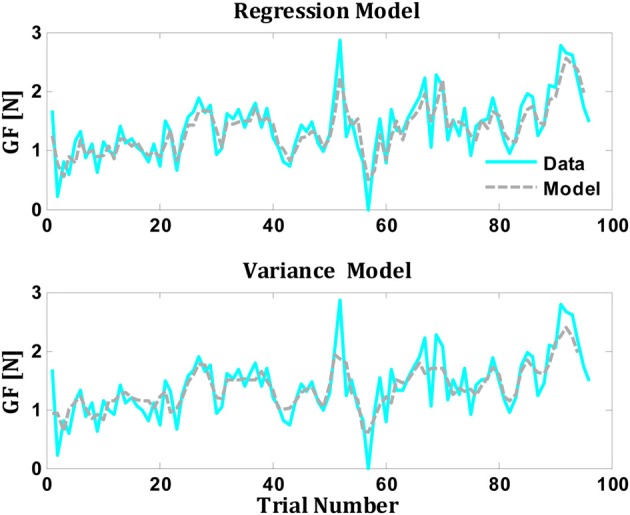
Figure 4.

Comparison between predictions of the regression and variance models for grip force from single subject (Data from Mawase and Karniel, 2010). The gray line represents the actual performance of the subject, while the colored line represents the model's prediction (upper panel for regression model and the lower panel for the variance model).
