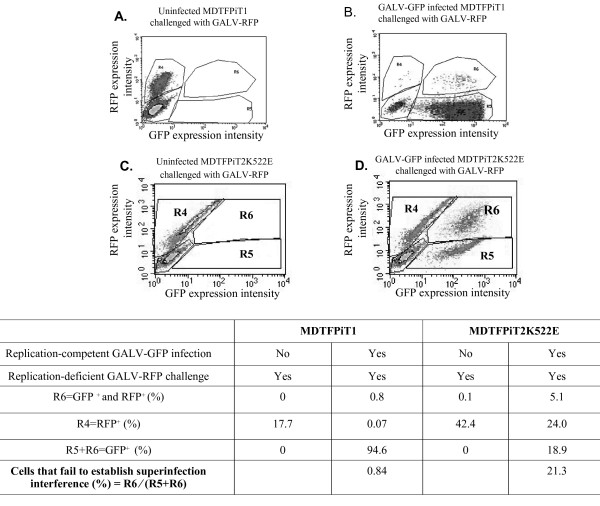
Figure 4.
MDTF cells expressing PiT2K522E cells fail to establish GALV superinfection resistance in. MDTF cells mock infected or infected with GALV-GFP for two weeks, were challenged with GALV enveloped retroviral vector expressing the fluorescent marker protein, cherry red (GALV-RFP). Two days later, cells were harvested for FACS analysis. MDTFPiT1 cells uninfected (A) and infected with GALV-GFP (B), MDTFPiT2K522E cells uninfected (C) or infected with GALV-GFP (D). The x-axis represents MFI of GFP expression and the y-axis represents MFI of RFP expression. Three experiments were performed and representative images were presented. Region statistics was also exhibited as R3, R4 and R5. R3 = GFP negative and RFP negative, R6 = GFP positive and RFP positive and R5 = GFP positive but RFP negative. The statistics are listed in the table below the figure. The percentage of cells that fail to establish superinfection resistance was calculated by the value in R6 divided by the total values in R6 and R5.

