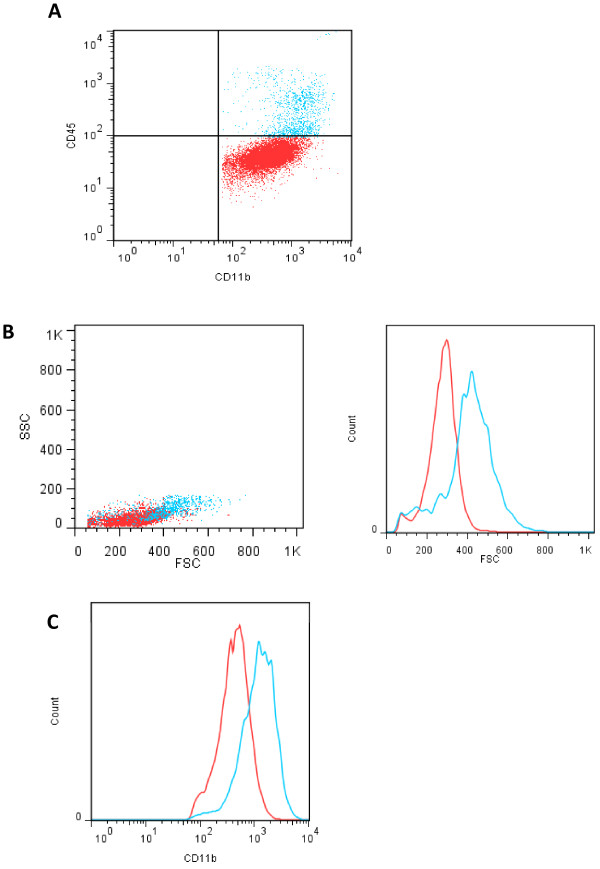
Figure 3.
Analysis of the CD11b+fraction. (A) After isolation, cells in the CD11b+ fraction were stained with anti-CD45 antibodies and analyzed by flow cytometry. Two CD45-expressing populations were identified: low (red) and high (blue). (B) Forward scatter (FSC) and side scatter (SSC) characteristics of CD11b+/CD45low (red) and CD11b+/CD45 high (blue) are shown. A histogram of FSC parameters comparing CD45low and CD45high cells is shown on the right. (C) Histogram showing the differences in CD11b expression between CD45low and CD45high cell populations.

