Figure 3.
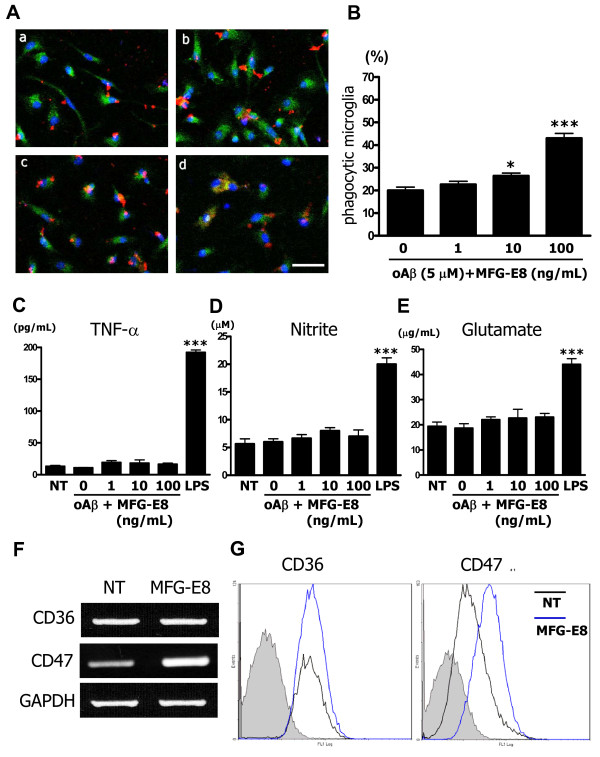
MFG-E8 induces microglial phagocytosis of oAβ. (A) Microglia were pre-treated with 1 ng/mL (b), 10 ng/mL (c) or 100 ng/mL (d) MFG-E8 for 1 h, and then 5 μM oAβ was added to the culture for 6 h. Primary antibodies recognizing Rab7 (green), oAβ (red) and nuclei (blue) were used (a − d). A few oAβ-incorporated microglia were detected in the absence of MFG-E8 (a), while a sufficient number of microglia that had engulfed oAβ were detected in the presence of the higher MFG-E8 dose (d) under confocal laser scanning microscope. Scale bar = 50 μm. (B) Quantification of the phagocytosis index, which is defined as the percentage of total microglial-Rab7 staining (green) that overlaps with oAβ staining (red). The results are presented as the means with S.E.M. (n = 3), in which 10 randomly selected fields were analyzed. Significant differences compared with samples that were only treated with oAβ (oAβ) are noted. *: P <0.05 (one-way ANOVA with Dunnett’s post-hoc test). The measurement of TNF-α (C), nitrite (D), and glutamate (E) produced by microglia treated with MFG-E8 plus oAβ was performed. After 24 h treatment with 1 ng/mL, 10 ng/mL or 100 ng/mL MFG-E8 with 5 μM oAβ, the supernatants of microglial cultures were analyzed. 100 ng/mL LPS treatment for 24 h was used as a positive control. The results are presented as the means with S.E.M. (n = 5). Significant differences compared to untreated microglia (NT) are noted. ***: P <0.001, (one-way ANOVA with Dunnett’s post-hoc test). (F) mRNA expression levels of oAβ phagocytosis-related cellular membrane surface antigens, CD36 and CD47, in microglia treated with 100 ng/mL MFG-E8 for 24 h was assessed using RT-PCR. GAPDH expression was used as a control. (D) CD36 and CD47 protein levels were assessed by FACS analysis. Microglia were treated with 100 ng/mL MFG-E8 for 72 h. The gray-filled curve represents the isotype-matched control. The black and blue lines indicate untreated (NT) and MFG-E8-treated samples, respectively.

