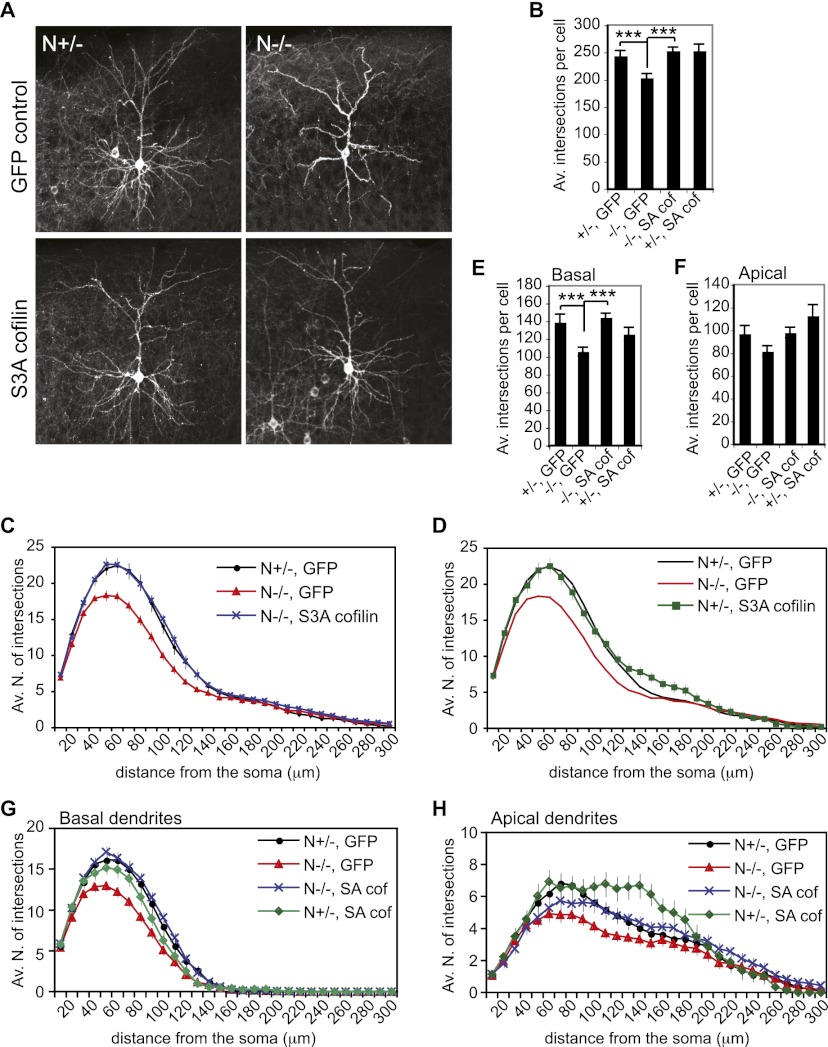
Figure 7.
Cofilin promotes dendritic branching in vivo. In vivo expression of S3A cofilin rescues dendritic complexity in N−/− upper-layer cortical neurons. E15.5 embryos were electroporated in utero with a myr-GFP-expressing construct alone or together with a construct for S3A cofilin. GFP fluorescence was analyzed postnatally in sections of P23 brains. Representative average projection images of GFP fluorescence in electroporated cortical neurons are shown in A. Z-stack movies are available in the Supplemental Material (Supplemental Movies 5–8). Sholl analysis was performed on GFP-positive neurons. The average number of total intersections per cell is shown in B. PANOVA = 1.0 × 10⁻⁵ ; P+/− GFP vs. −/− GFP = 7.0 × 10⁻⁴; P−/− GFP vs. −/− SA = 3.5 × 10⁻⁶; P+/− GFP vs. +/− SA = 0.5. Sholl profiles for N−/− and N+/− animals electroporated with S3A cofilin are shown in C and D, respectively, together with GFP control electroporated animals. (E–H) The complexity of basal and apical dendrites was independently analyzed. The average total number of basal or apical intersections per cell is shown in E and F, respectively. (E) PANOVA=5.4 × 10⁻⁵; P+/− GFP vs. −/− GFP = 0.0009; P+/− GFP vs. −/− SA = 0.59; P−/− GFP vs. −/− SA = 4.7 × 10⁻⁷; P+/− GFP vs. +/− SA = 0.29. (F) PANOVA=9.0 × 10⁻³; P+/− GFP vs. −/− GFP = 0.06; P+/−GFP vs. −/− SA = 0.93; P−/− GFP vs. −/− SA = 0.02; P+/− GFP vs. +/− SA = 0.18. The Sholl profiles for basal and apical dendrites are shown in G and H, respectively. Four N−/− GFP, three N+/− GFP, three N−/− S3A cofilin, and two N+/− S3A cofilin animals were used for analysis. Ten cells were analyzed per animal.

