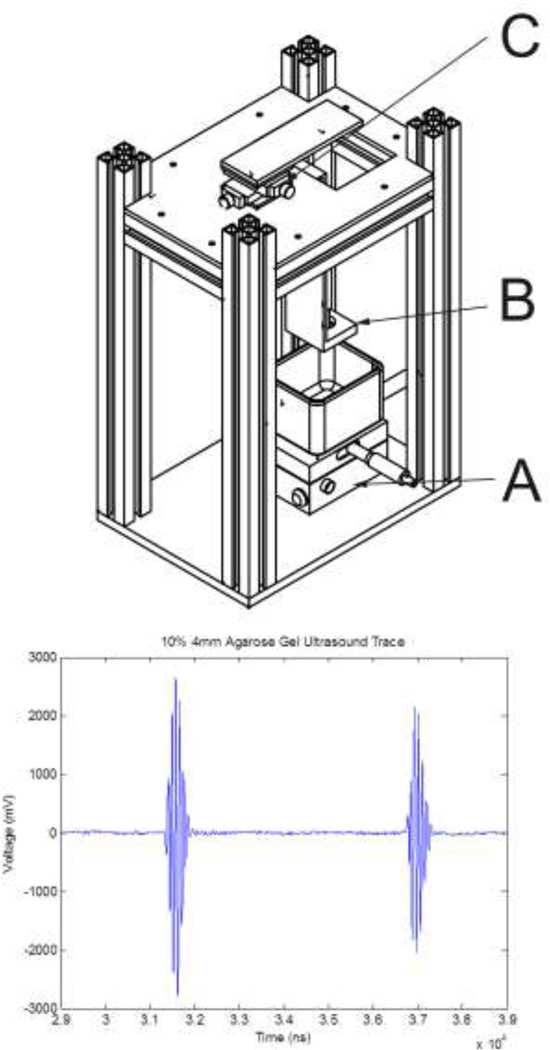
Figure 1.
(Top) Ultrasound fixture. A: lower X–Y table allows for positioning of the sample relative to the transducer, which is held by the bracket B. An upper X–Y table (C) controls the incident angle of the ultrasound beam. (Bottom) Representative plot of ultrasound tracing illustrating the returns off the top and bottom surfaces of the agarose gel. The peak to peak separation was used to determine the speed of sound.

