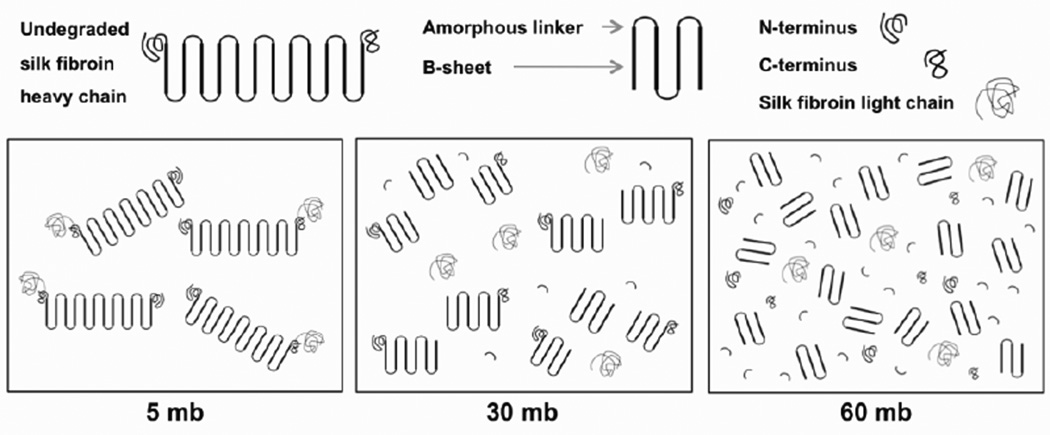
Figure 8.
(A) Fluorescence emission spectra of silk solutions from silk fibers degummed for different durations. Each spectrum has a peak at 307 nm and a shoulder around 330 nm. (B) The emission value at 330 nm for each sample was found to be different (*p<0.01, n=8). Since silk solutions degummed for 5, 30, and 60 minutes have similar amino acid sequences, the difference in emission spectra was not due to residual sericin but due to the difference in molecular weight distribution. The error bars represent the standard error of the mean.

