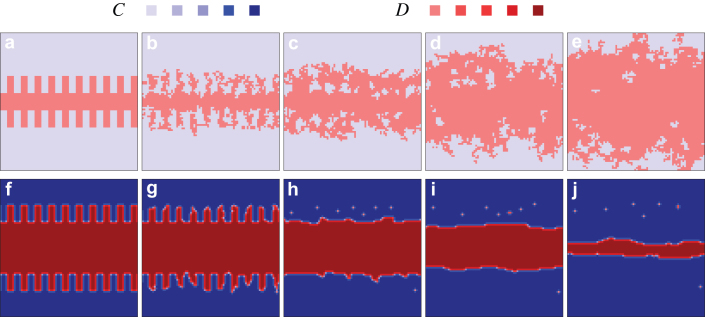
Figure 4. Interfaces that separate domains of cooperators and defectors remain smooth if the “wisdom of groups” is taken into account.
Depicted is the evolution of a prepared initially rough interface, as obtained for α = 0 [top panels from (a) to (e)], i.e., ignoring the “wisdom of groups”, and for α = 4 [bottom panels from (f) to (j)]. It can be observed that by taking into account the wider knowledge of the group (bottom row), the roughening of the interfaces is prevented. Cooperators therefore rise to dominance (the final pure C phase is not shown). In the upper row the defectors are able to invade the cooperative domains aggressively, which in turn further roughens the interfaces and eventually leads to a pure D phase (not shown). Note that to distinguish different learning activities w of players, we have used different shades of blue (for cooperators) and red (for defectors), as indicated in the figure legend. Lighter colors correspond to higher learning activity while darker colors denote players with lower learning activity. For α = 0 all players constantly have w = 1, and are accordingly depicted by the brightest shades of blue and red. The snapshots were taken at MCS = 0, 10, 30, 70 and 100 for the top row, and at MCS = 0, 200, 1400, 6000 and 19000 for the bottom row. In both cases the temptation to defect was set equal to b = 1.07 and the system size was L = 80 (small solely to ensure a proper resolution of the relevant spatial patterns).

