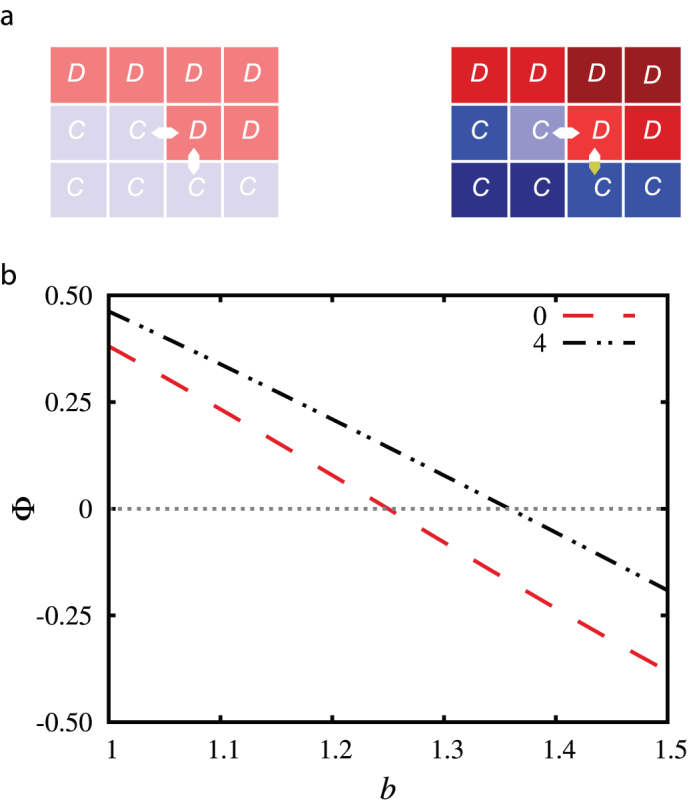
Figure 6. Schematic presentation of the leading invasion process and the corresponding difference of invasion probabilities with and without taking into account the “wisdom of groups”.

Arrows in the top two panels depict the leading invasion process for α = 0 (left) and α = 4 (right). The invasion that is marked by the gray arrow in the right panel becomes practically irrelevant due to large α (see main text for details). The color code is the same as used in Figs. 4 and 5 to distinguish players with different learning activities. Lower panel depicts the normalized difference of invasion probabilities Φ of C → D and D → C strategy changes in dependence on the temptation to defect b at K = 0.5. It can be observed that for α = 4 the invasion front changes sign at a higher value of b than for α = 0, thus corroborating the reported promotion of cooperation due to the “wisdom of groups” at the microscopic level of the evolutionary process.
