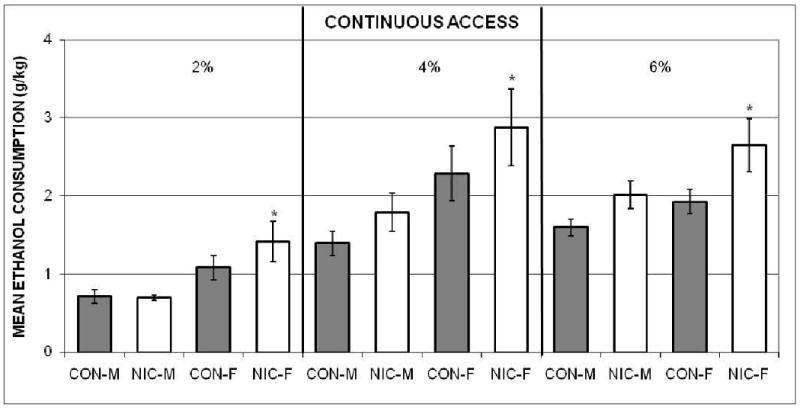
Figure 4.

The mean amounts (± SEMs) of 2% ethanol (left panel), 4% ethanol (middle panel), and 6% ethanol (right panel), adjusted for body weights, consumed by the Nicotine-exposed male (NIC-M) and female (NIC-F), and vehicle control male (CON-M) and female (CON-F) groups during the continuous-access to ethanol (fade-in procedure) in Experiment 2. *indicates significant difference from both male groups.
