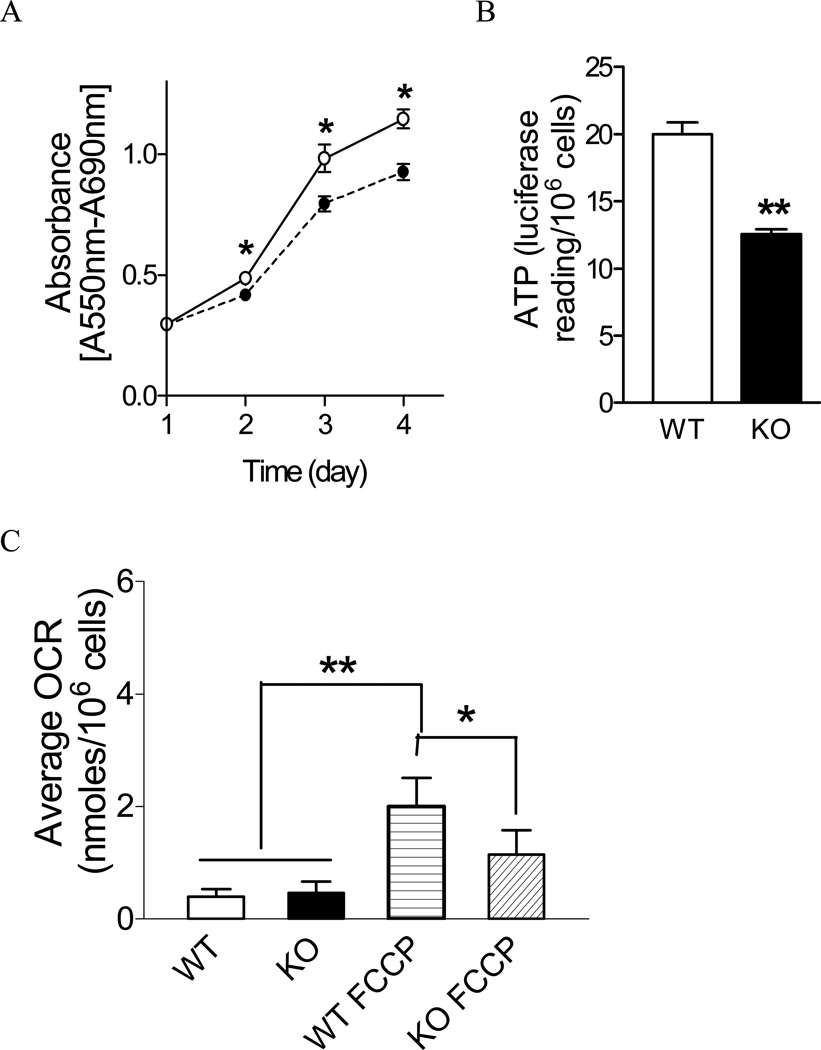
Figure 3. Proliferation of Sod2−/− cells and mitochondrial function.
(A) Wild-type (solid line with open circle (○)) and Sod2−/− cells (dotted line with solid circle (●)) were seeded equally onto 96-well plates as described in the Materials and Methods section. Cell growth was monitored by MTT assay every 24 hours. Data represent three different experiments. *p < 0.05 between wild-type and Sod2−/− MEFs at each time point. (B) ATP production measured in whole cell. **p < 0.01 between wild-type and Sod2−/− MEFs. (C) Oxygen consumption (OCR) measured by Seahorse Bioscience Extracellular Flux Analyzer XF24. *p < 0.05 between wild-type and Sod2−/− MEFs treated with FCCP; **p < 0.05 between untreated and FCCP-treated cells. WT: wild type; KO: Sod2−/− MEF.

