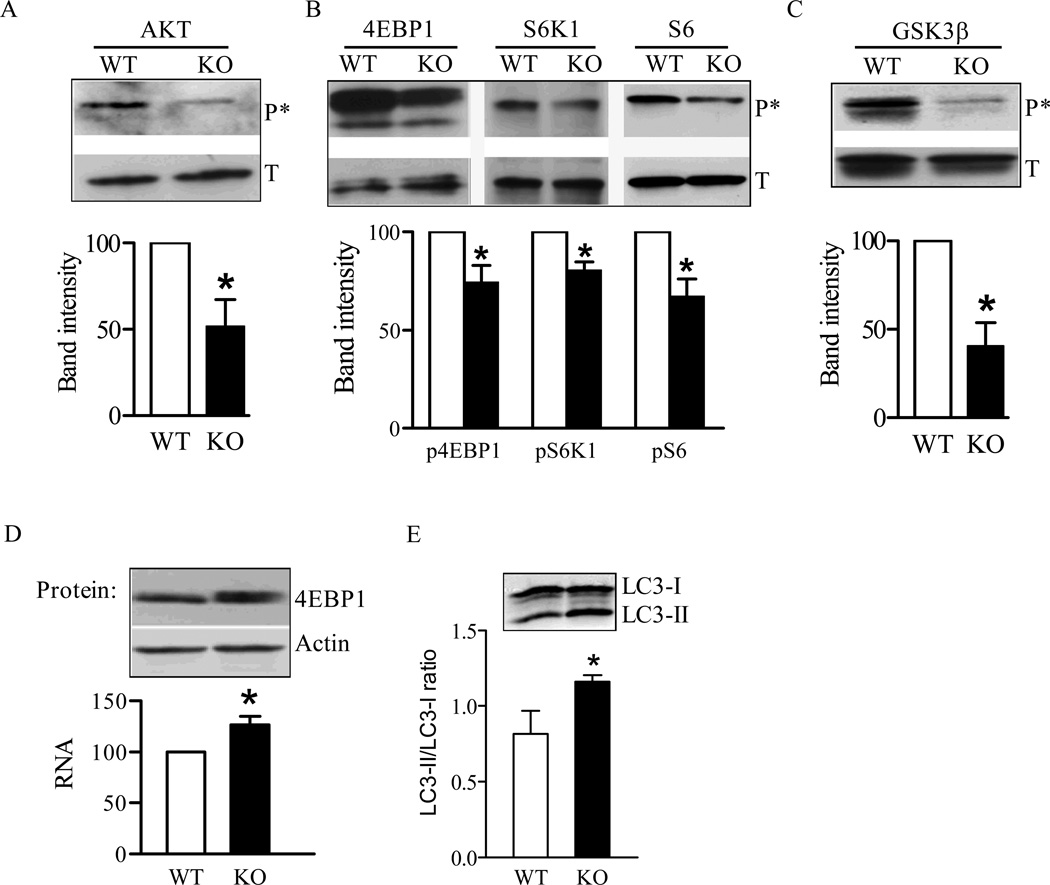
Figure 5. Abnormal cell signaling in Sod2−/− MEFs.
Phosphorylation of different signaling proteins were detected with phosphorylation specific antibodies as described in the Materials and Methods section: (A) Phosphorylation of Akt; (B) Phosphorylation of 4EBP1, p76SK1, and S6; (C) Phosphorylation of GSK3. (D) Expression of 4EBP1 in Sod2−/− cells detected as mRNA transcription by real-time quantitative RT-PCR (lower graph) and as protein by Western blot analysis (upper panel). (E) Detection of autophagy by Western blot analysis of LC3 modification. Differences of band intensity between wild-type (WT) and Sod2−/− MEFs (KO) were presented in the lower graph. *p < 0.05 and **p < 0.01 between WT and Sod2−/− cells for respective target protein. Data were generated from three different experiments.

