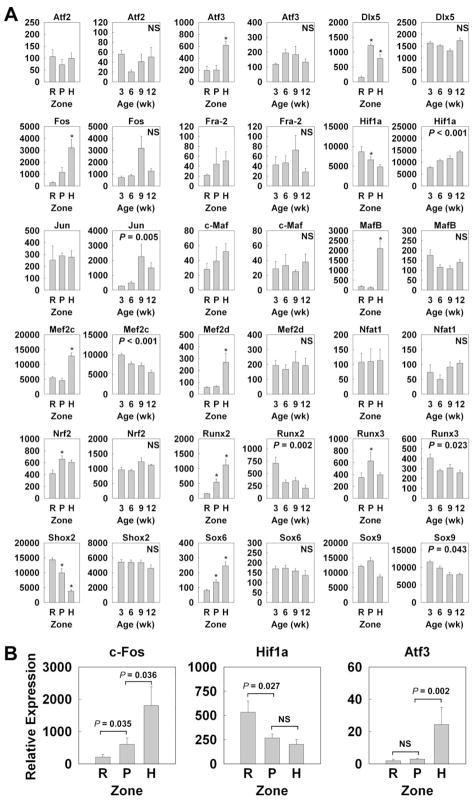
Figure 4. Spatial and Temporal changes in gene expression (mean ± SEM) of transcription factors implicated in growth plate cartilage.
(A) Relative expression of mRNA was measured by expression microarray (Affymetrix Rat Genome Array 230 2.0). Spatially, mRNA in different zones of growth plate of 1 wk old rats was compared. Temporally, mRNA in proliferative zone at 3, 6, 9 and 12 wk old rats was compared. The data was background corrected and normalized using the MAS5 statistical algorithm. *, P < 0.05 compared with the preceding zone; NS, not significant (B) For significant spatial changes, the relative expression of c-Fos, Hif1a, and Atf3 was verified using quantitative real-time PCR. RZ, resting zone; PZ, proliferative zone; HZ, hypertrophic zone.

