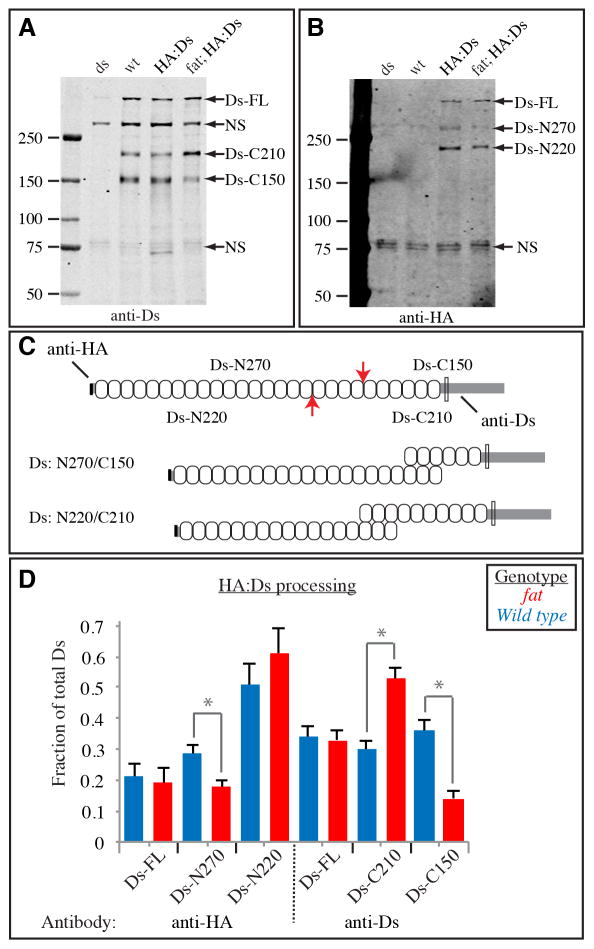
Figure 4. Endoproteolytic processing of Ds.
A,B) Western blot on lysates of wing discs, from ds mutant (dsUA071/ds36D), wild-type, HA:Ds-expressing, and HA:Ds-expressing fat mutant (fat8/fatG-rv). The left lane contains size markers of the indicated molecular weights. The presumed identities of bands in other lanes are indicated by the labels to the right. The same membrane is depicted in both panels, A shows the results of anti-Ds staining, B shows the results of anti-HA staining. C) Schematic of Ds protein. Upper indicates the approximate locations of endoproteolytic cleavage sites (red arrows) and the resulting polypeptides, and the epitopes of antisera used. Ovals indicate cadherin domains, the transmembrane domain is indicated by the thin rectangle. Lower indicates the Ds isoforms that could result from cleavage at the two different sites. D) Quantitation of Ds processing. The fraction of Ds in each of the three bands detected by each antisera was calculated by summing the intensities of all bands. Bars show the average results from six Western blots on three independently prepared lysates, error bars indicate standard error of the mean. The influence of Fat on Ds processing was significant by t test evaluation of the differences between the fractions of the isoforms indicated by gray bars and asterisks (Ds-N270, P=0.025, Ds-C210, P=0.0008, Ds-C150, P=0.0004). For Ds-N220 the difference was not significant (P=0.36). See also Fig. S3.

