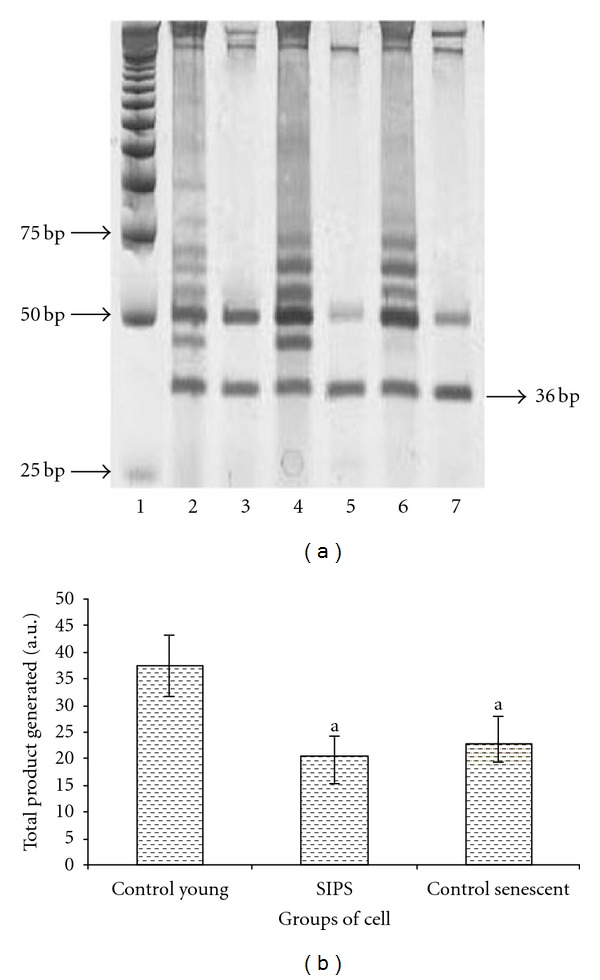
Figure 4.

Representative PCR analysis for telomerase activity of control young, SIPS, and control senescent HDFs. Lane 1, molecular weight marker, lane 2, control young, lane 3, control young (heat treated), lane 4, SIPS, lane 5, SIPS (heat treated), lane 6, control senescent, and lane 7, control senescent (heat treated). Band at 36 bp represents the internal control for the assay (a). Telomerase activity (Total Product Generated, TPG) of control young, SIPS, and control senescent HDFs. Reduction in telomerase activity was observed in SIPS and control senescent HDFs (b). adenotes P < 0.05 compared to control young HDFs. Data is presented as mean ± SD, n = 6.
