Figure 5.

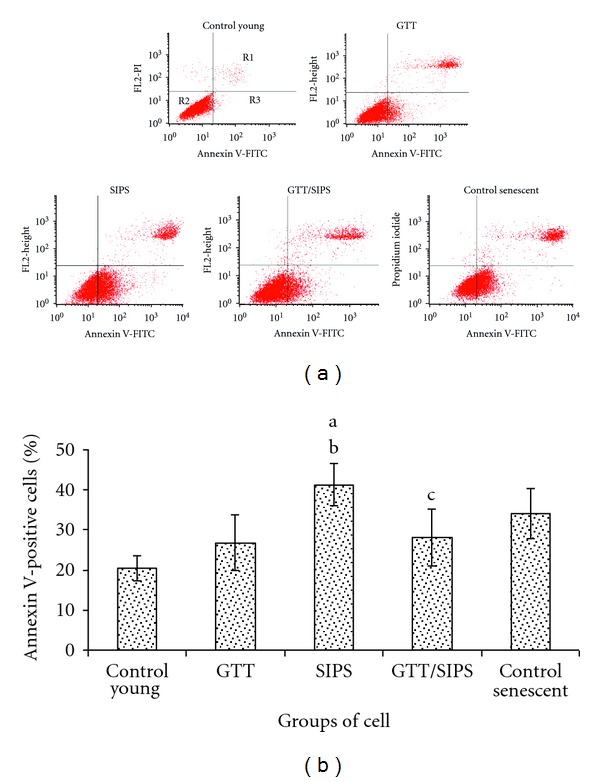
Contour diagram of FITC-Annexin V/PI double staining by flow cytometry. The three quadrants represent different cells conditions: the upper right quadrant (R1); nonviable, late apoptotic and necrotic cells (FITC+/PI+), lower left quadrant (R2); viable cells (FITC−/PI−), and lower right quadrant (R3); early apoptotic cells (FITC+/PI−) (a). Percentage of cells at early apoptotic stage demonstrated by FITC+/PI− (b). Data are expressed as means ± SD, n = 6. adenotes P < 0.05 compared to control young, b P<0.05 compared to GTT, and c P<0.05 compared to SIPS.
