Figure 8.

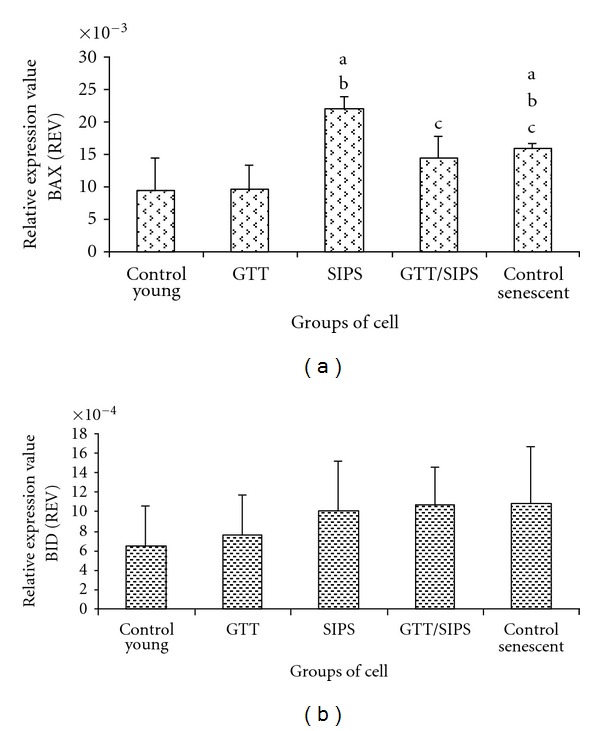
Relative expression value of proapoptotic genes BAX (a) and BID (b). Data are expressed as means ± SD, n = 6. adenotes P < 0.05 compared to control young, b P < 0.05 compared to GTT, and c P < 0.05 compared to SIPS.

Relative expression value of proapoptotic genes BAX (a) and BID (b). Data are expressed as means ± SD, n = 6. adenotes P < 0.05 compared to control young, b P < 0.05 compared to GTT, and c P < 0.05 compared to SIPS.