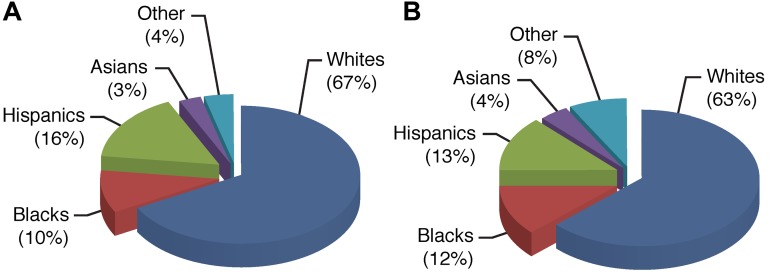
Figure 2.
Use of germline variation to define ancestry (> 90% European ancestry for whites, > 10% Native American ancestry for Hispanics, > 70% African ancestry for blacks, and > 90% Asian ancestry for Asians). The population of children (n = 2534) with ALL in the United States (A)55 displays the ancestral diversity that is comparable to that observed in the entire United States population (B; based on self-declared status; United States Census Bureau, 2000), with a slightly lower proportion of blacks and a slightly higher proportion of Hispanics among patients with ALL (reflecting lower incidence of ALL in black children and higher incidence of ALL in Hispanic children).

