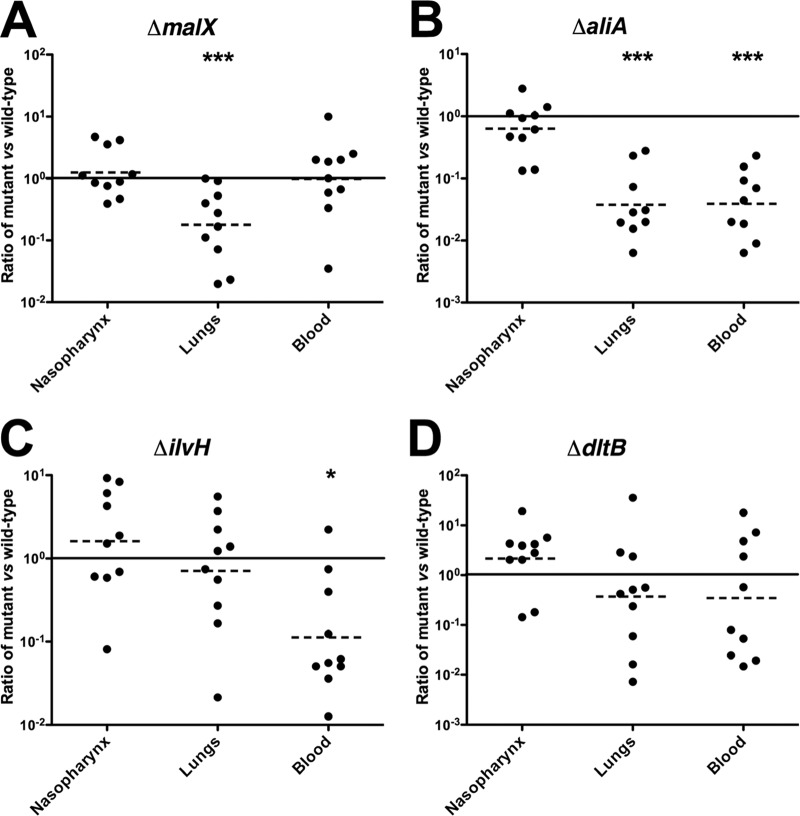
Fig 3.
Competition experiments between wild-type WCH43 and its isogenic mutants in the nasopharynx, lungs, and blood of mice at 48 h postinfection. (A) Wild type versus ΔmalX mutant; (B) wild type versus ΔaliA mutant; (C) wild type versus ΔilvH mutant; (D) wild type versus ΔdltB mutant. Ten CD1 mice were infected i.n. with equal numbers (approximately 1 × 10⁷ CFU each) of wild type and mutant in each experiment. Each datum point represents the ratio of recovered mutant bacteria to wild-type bacteria. The horizontal solid line represents a 1:1 ratio of recovered mutant bacteria. The horizontal broken line denotes the geometric mean value of the ratio of recovered mutant bacteria for each comparison. *, P < 0.05; ***, P < 0.001; one sample t test; two tailed.

