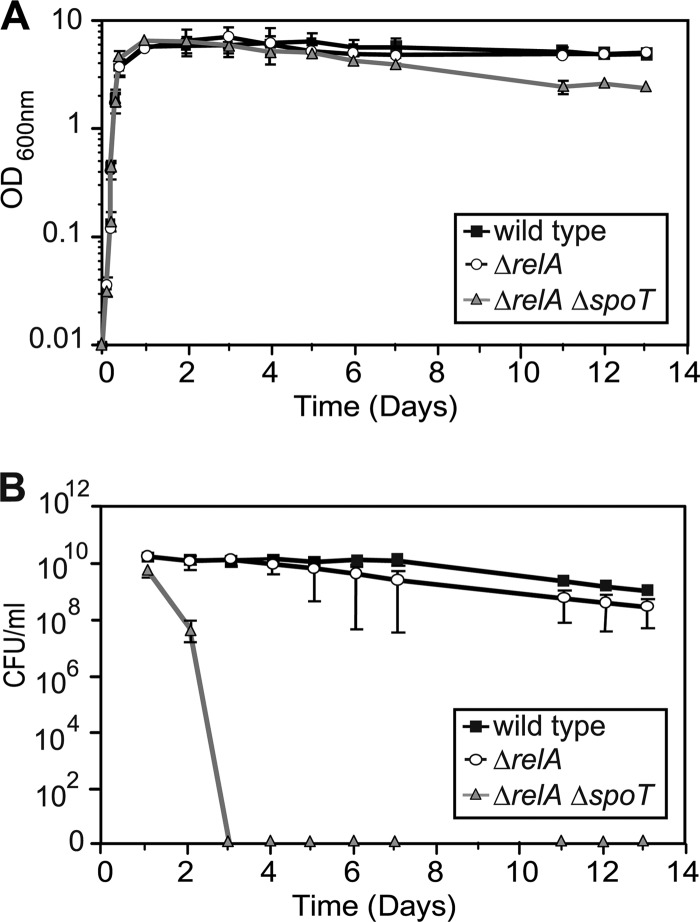
Fig 2.
Growth and stationary-phase survival of wild-type K96243 and isogenic mutants. All strains were inoculated into LB broth at an optical density of 0.01, and cultures were incubated at 37°C with aeration. (A) Growth curve representing the optical densities of the cultures at the indicated time points. (B) Stationary-phase survival of the strains determined by plating samples onto LB agar plates at the indicated time points. All experiments were performed in at least three independent experiments, and data are plotted on a logarithmic scale as means with standard deviations (A) or standard errors of the means (B) for those experiments.

