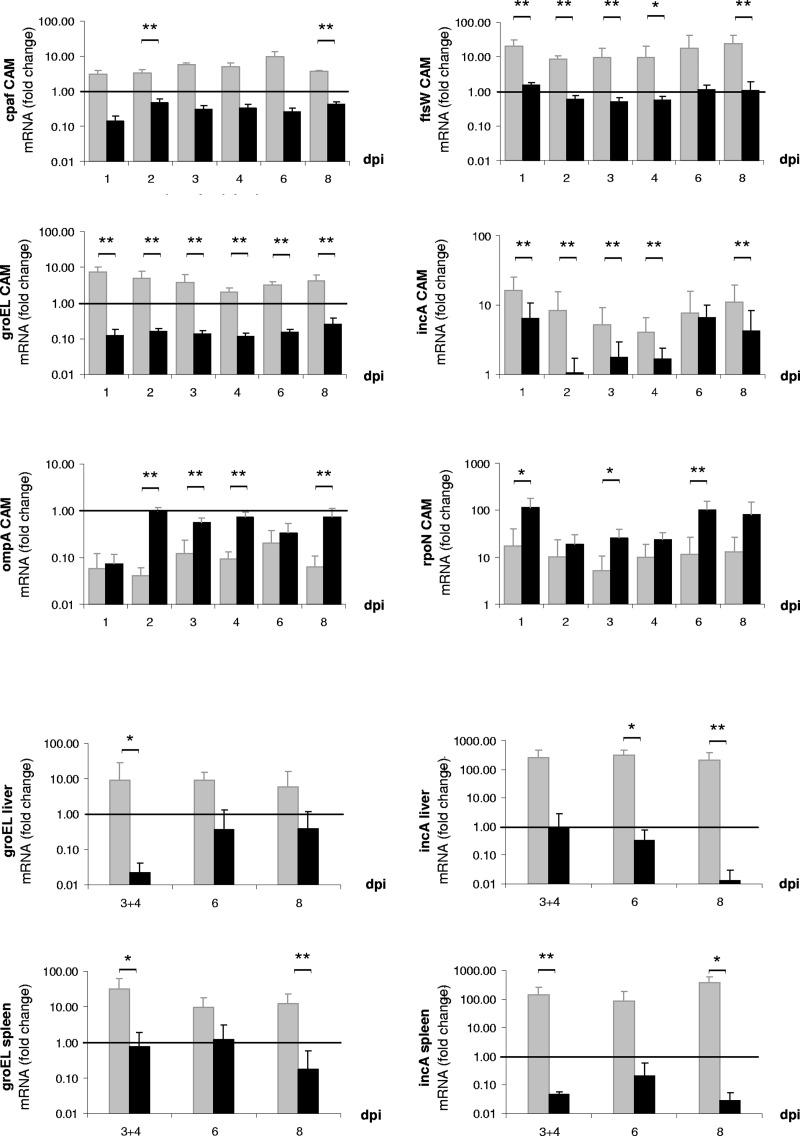
Fig 5.
mRNA expression levels of virulence-associated genes of C. psittaci (gray bars) and C. abortus (black bars) in tissue of CAM and embryonic liver and spleen. Data are presented as fold changes compared to chlamydial inocula prior to administration. Means are significantly different (*, P ≤ 0.05; **, P ≤ 0.01) between C. psittaci and C. abortus (calculated by Mann-Whitney U test).

