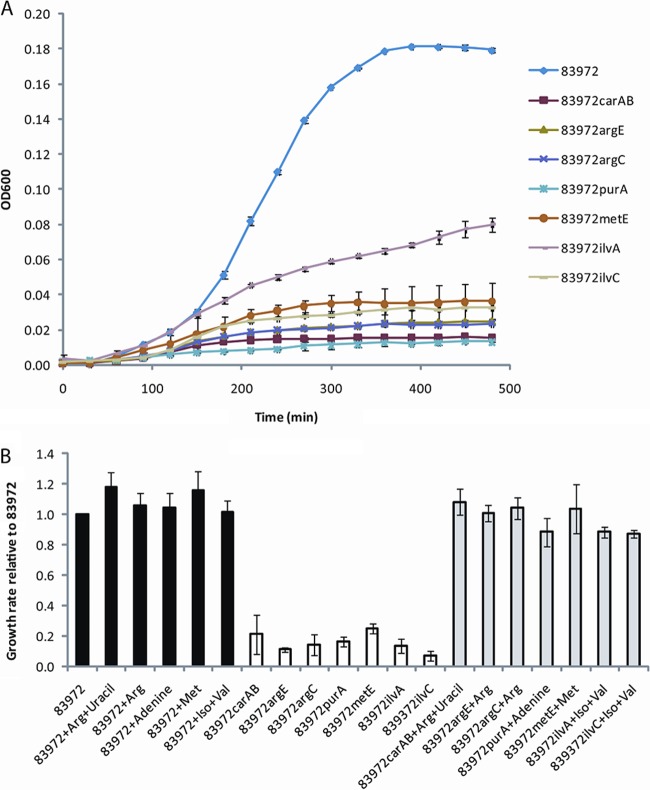
Fig 2.
Growth of E. coli 83972 and its isogenic mutants in human urine. (A) The curves are shown as means of four replicates, and error bars indicate standard deviations (σn−1). (B) Growth rates of E. coli 83972 in human urine with and without addition of amino acids and/or nucleobases (black) and growth rates of its mutants in urine without (white) and with (gray) addition of amino acids and/or nucleobases. Growth rates are displayed as means of triplicates of independent experiments relative to the growth rate of E. coli 83972 grown in human urine with no addition of amino acids. Error bars indicate standard errors.

