
Figure 2.
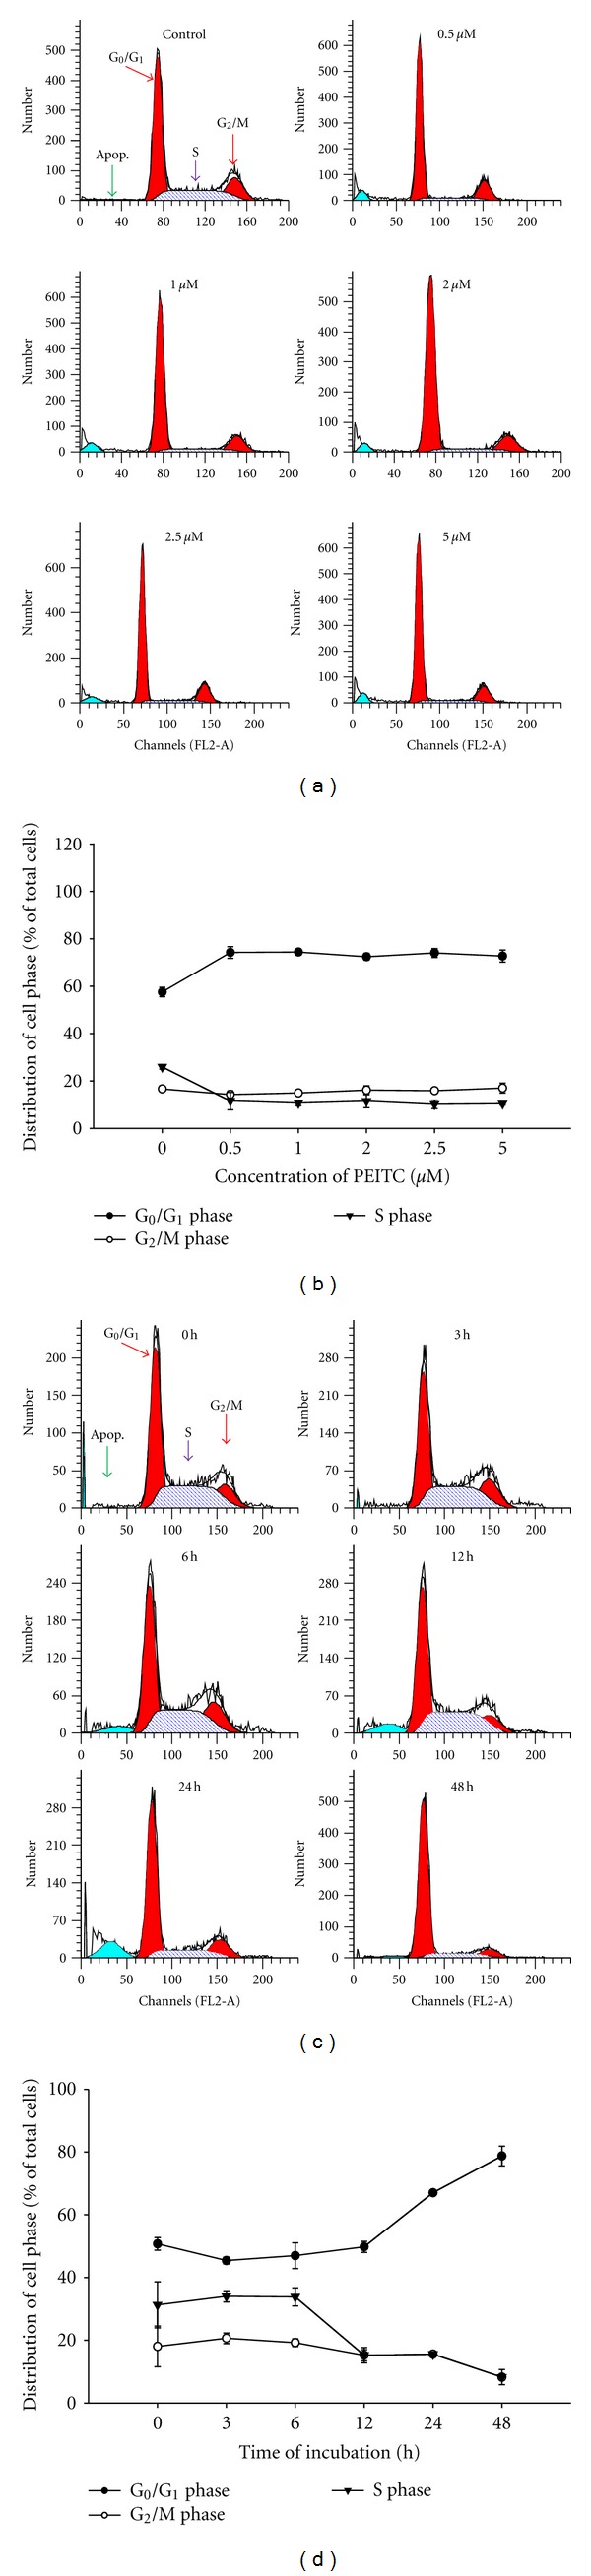
PEITC affected on cell-cycle distribution in HSC-3 cells. Cells were treated with 0, 0.5, 1, 2, 2.5, and 5 μM of PEITC for 24 h or were treated with 2.5 μM of PEITC for 0, 3, 6, 12, 24, and 48 h. The cell-cycle distribution was determined by using flow cytometric analysis (a and c), and cell-cycle distribution was quantified (b and d). Data are presented as the mean ± S.E.M. of three independent experiments. *P < 0.05, significantly different compared with 0 h treatment.