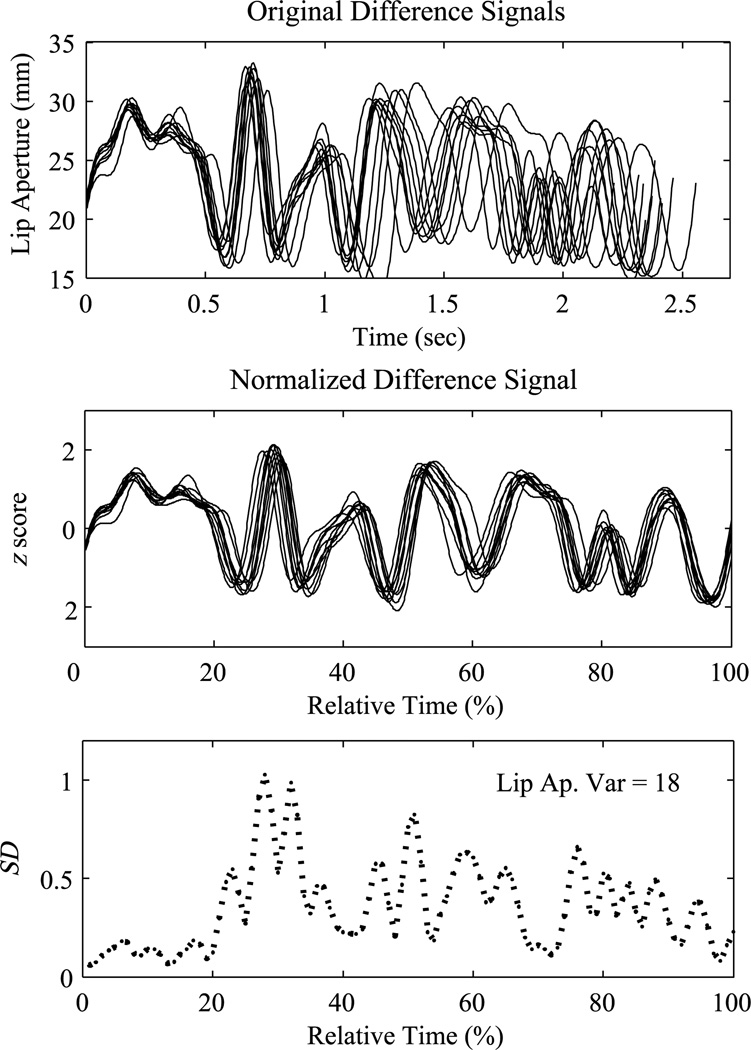
Figure 2.
Lip aperture (LA) variability index calculation. The top panel shows 10 LA displacement trajectories of the sentence, The boys and the pipers baked moist pumpkin pies, spoken by a control participant. Zero on the y-axis of this panel represents minimal interlip distance or lip closure. Because the markers were placed on the vermilion border of the participant’s upper and lower lip, intermarker distance should not be 0 at closure. In the middle panel, the trajectories have been time- and amplitude-normalized and, as a result, closely align. The bottom panel shows the SDs of the 10 normalized LA trajectories computed at successive intervals as a function of relative time. The LA variability index is reported in the inset. Lip Ap. Var = lip aperture variability.

