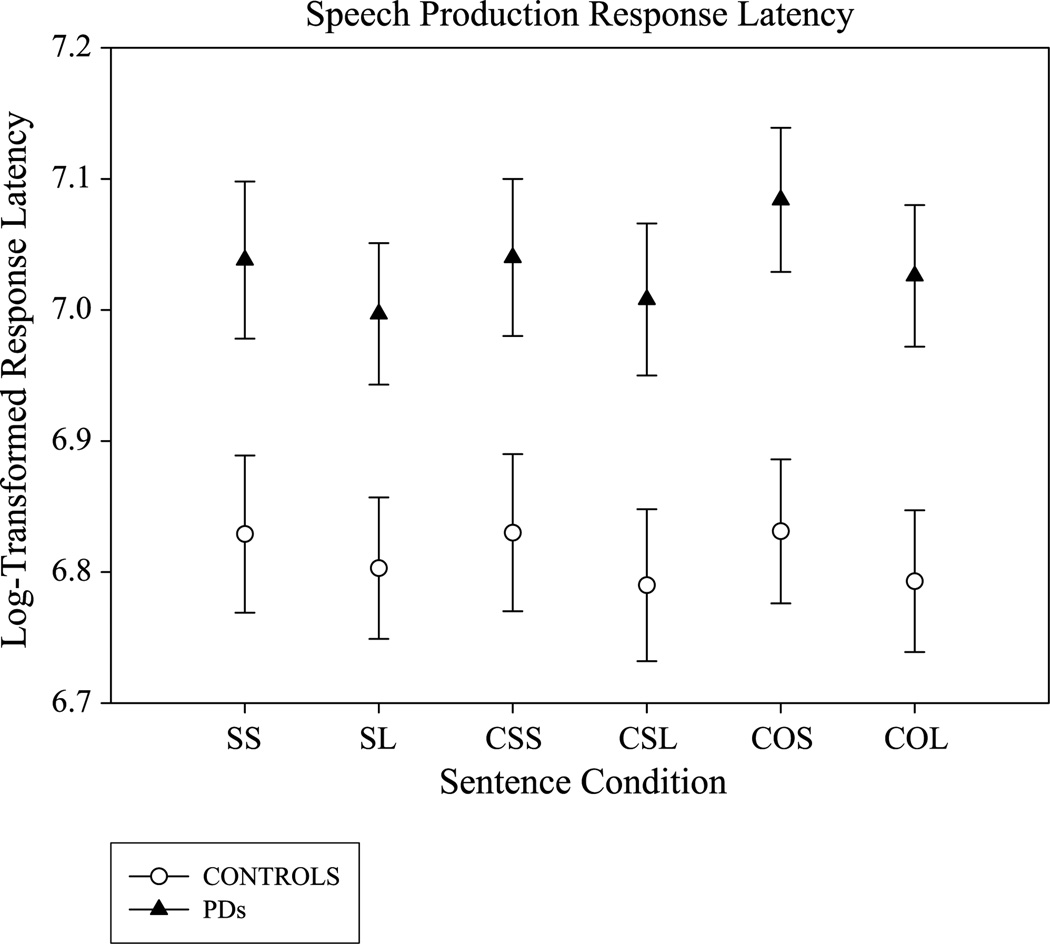
Figure 3.
Mean and standard error bars for log-transformed speech production response latencies are plotted for the individuals with Parkinson’s disease (PD; filled triangles) and control participants (open circles) as a function of the six sentence conditions (simple, short [SS]; simple, long [SL]; complex, subject-relative, short [CSS]; complex, subject-relative, long [CSL]; complex, object-relative, short [COS]; and complex, object-relative, long [COL]).

