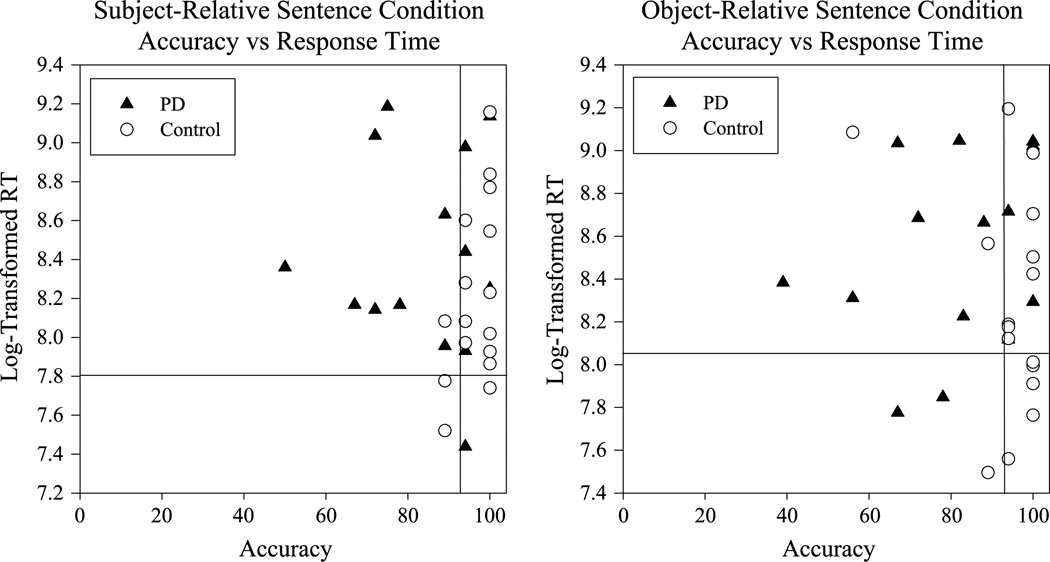
Figure 5.
Data points for sentence comprehension accuracy (x-axis) are plotted for 14 of the individuals with PD (filled triangles) and 16 control participants (open circles) against his or her log-transformed average sentence comprehension response time (y-axis). The left graph in this figure shows data from the subject-relative sentence condition, and the right graph shows data from the object-relative sentence condition. In these graphs, the vertical and horizontal solid lines indicate the median value across all participants for each variable. RT = response time.

