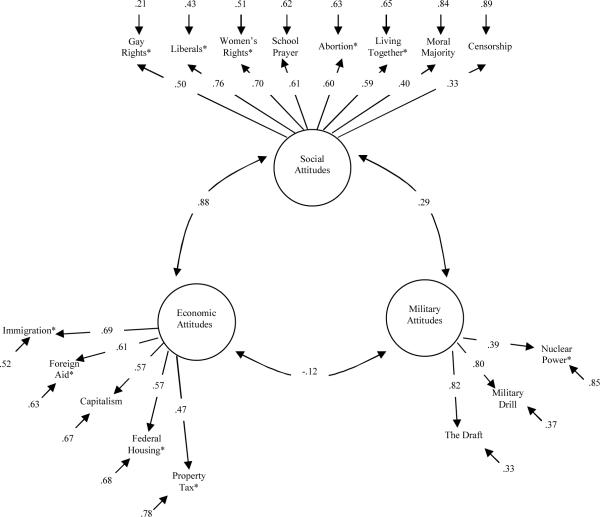
Figure 1.
Standardized Confirmatory factor loadings for the ideological dimensions
CFI = 0.928, TLI = 0.938, RMSEA = 0.063
Note: The items with asterisk were recoded to load positively on the traits prior to the analysis. Higher scores on the factor are more conservative. In the analysis, there were 12,088 individuals nested within 6,046 families.

