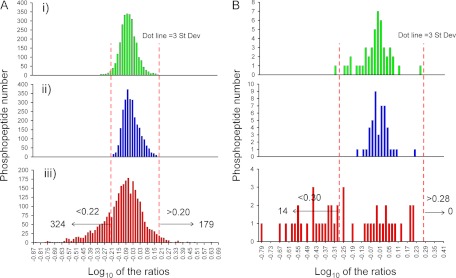
Fig. 3.
Distribution of relative levels of phosphopeptides in control versus stimulated T lymphocytes. Histograms showing logarithm base 10 of the ratios between the indicated iTRAQ reporter ions were constructed for the phosphoserine/threonine containing peptides (A) and phosphotyrosine peptides (B). Technical replicates of the control versus control sample (114/116 ions) (panels i) and stimulated versus stimulated sample (115/117 ions) (panels ii) represent stochastic variation of reporter ion intensities during analysis. Log10 ratios of the average values for the control sample (114 and 116) and the stimulated sample (115 and 117) are in panels iii). Three times the biggest value of the standard deviation of the log10 ratios in distributions in panels i and ii was selected as a threshold for significant changes in relative levels in panel iii (0.21, equivalent to 1.6-fold change in A; 0.295, equivalent to a 1.8-fold changes in B). The mode of the distribution in A, panel iii, is −0.01, so phosphopeptides with a logarithm of area ratios in A, panel iii, smaller than −0.22 are considered up-regulated, and those with a logarithm greater than 0.2 down-regulated after TCR stimulation. In B, panel iii, phosphopeptides with values smaller than −0.31 are considered up-regulated, and those with values greater than 0.28 down-regulated after TCR stimulation. In total, 517 phosphorylation sites were TCR-regulated after 5 min of CD3 stimulation.

