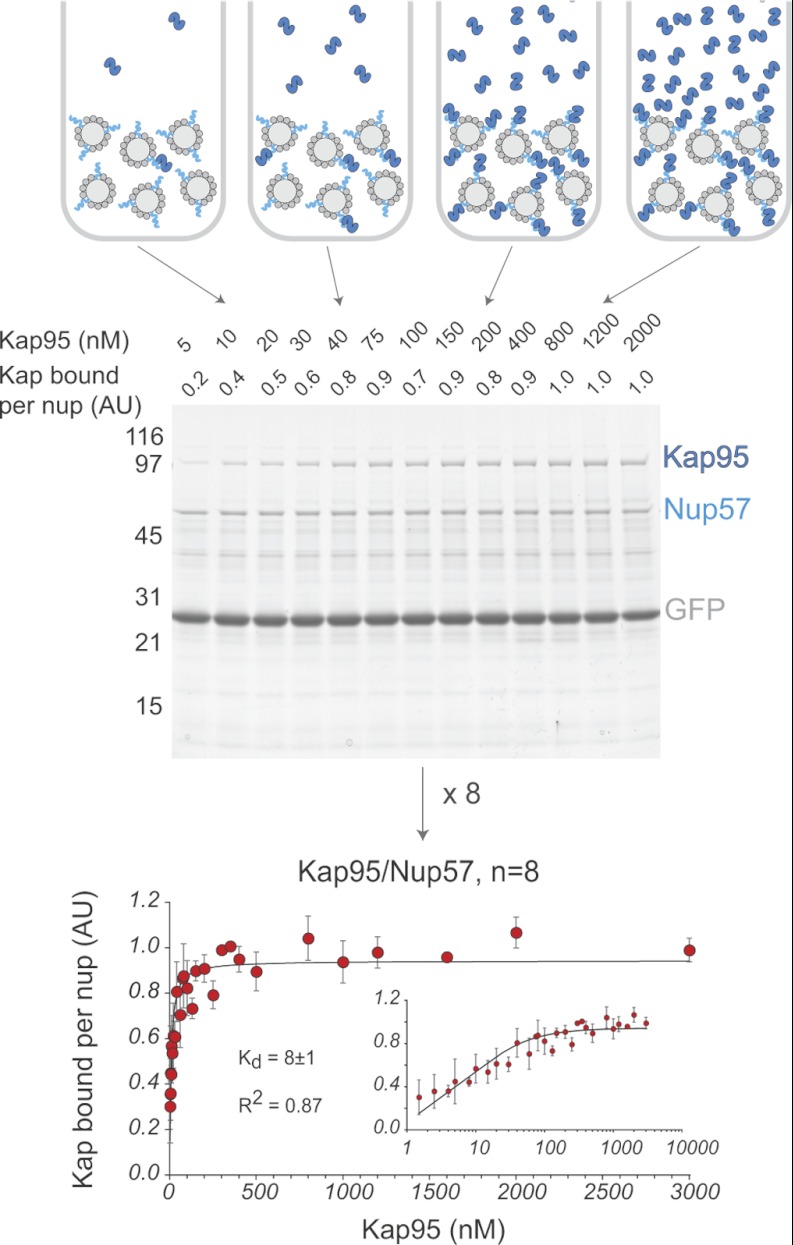
Fig. 2.
Measurement of Kap/FG nup affinities in vitro. Top panel, schematic of the bead binding assay. Dynabeads TALON (light gray) are saturated with His-tagged FG nups (turquoise) and GFP (dark gray). The beads are then incubated with increasing concentrations of Kap (dark blue). Middle panel, protein eluted from the beads is run on an SDS-PAGE gel and stained with Coomassie Blue. Band intensities are quantified by densitometry. Quantification is shown on the top of the gel. Molecular mass markers (in kilodaltons) are shown to the left. Bottom panel, the normalized and averaged data from eight measurements of the Kap95/Nup57 interaction are plotted (error bars showing standard deviation), and the best fit as calculated by Sigma Plot using Equation 1 is shown as a black line. The inset shows the data on a log/linear scale.

