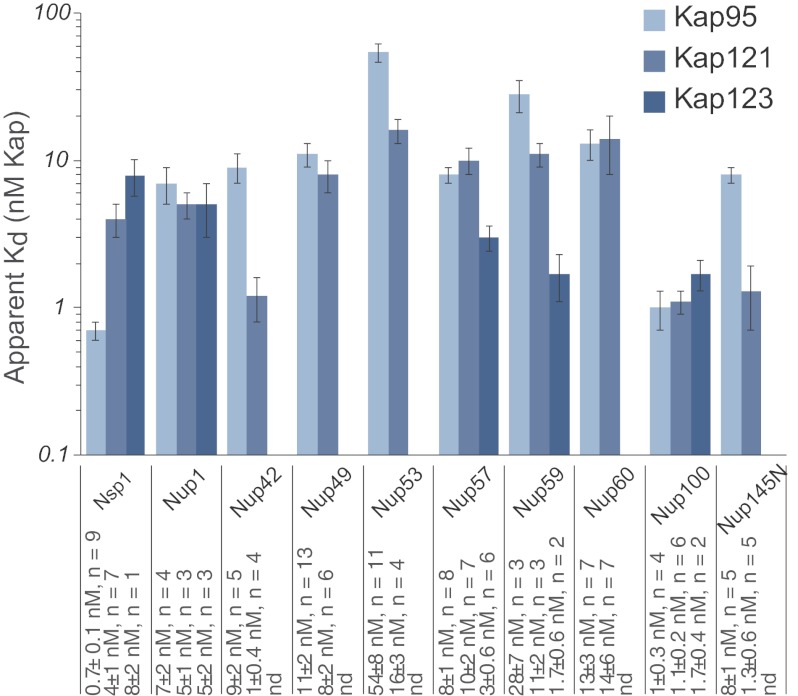
Fig. 4.
Summary of the Kap/FG nup affinities as measured by bead binding assay. Kd values and the number of repeats are indicated below the plot. The error bars are the error of the fit as calculated by Sigma Plot using Equation 1. For clarity, the data are shown on a log/linear scale.

