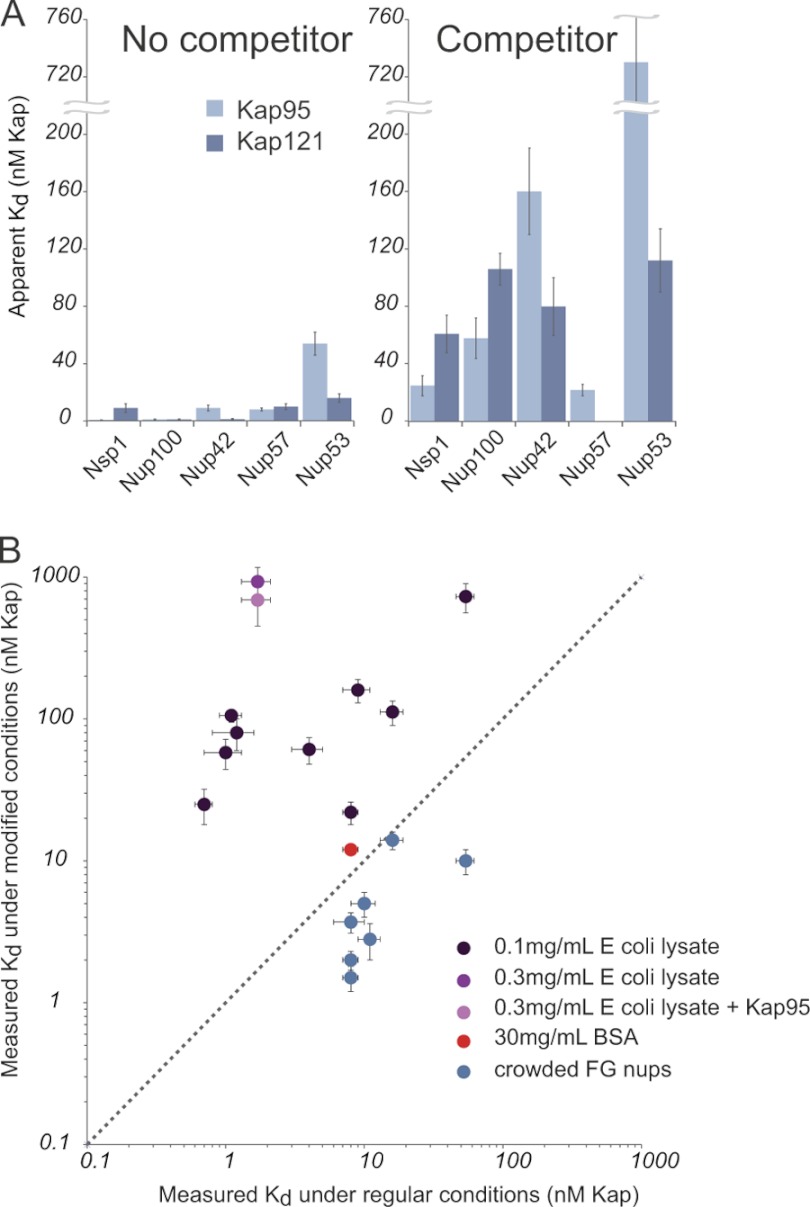
Fig. 6.
Lysate, but not crowding or BSA, significantly decreases the apparent affinities between all Kaps and FG nups measured. A, Kap/FG nup affinities as measured with and without indicated competitor. The pale blue bars are Kap95, and the dark blue bars are Kap121. B, plot of the measured affinity using the bead binding assay in unmodified (x axis) and modified (y axis) conditions: 0.1 mg/ml E. coli lysate, 0.3 mg/ml E. coli lysate, and 0.3 mg/ml E. coli lysate + Kap95 (dark, medium, and pale purple data points, respectively), 30 mg/ml BSA (red), and in the crowded condition (blue) (supplemental Fig. 12). The dotted line shows where the affinities would be if they were equal in the two conditions. Increasing FG nup density on the beads slightly increases the measured affinities, while adding small quantities of lysate significantly reduced the measured affinities. Adding up to 30 mg/ml BSA did not significantly change the affinity between Kap121 and Nup49, whereas merely 0.1 mg/ml of lysate did.

