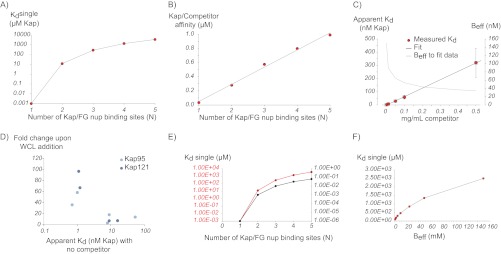
Fig. 9.
Plots illustrating results from the simple model. A, calculated values of Kdsingle required to reproduce the experimental data for different numbers of Kap/FG nup binding sites (N) for Beff = 150 mm. B, calculated Kap/competitor affinities needed to reproduce the experimental affinities for different values of N, showing that competitor has a stronger effect for higher valency interactions. C, experimental Kap/FG nup affinities depend strongly on concentration of competitor protein (red dots), which is fit with our model (black line) by allowing Beff to depend on competitor concentration (gray line). D, experimental Kap/FG nup affinities are inversely correlated with the fold change upon the addition of competitor as predicted by the model. Light blue circles are Kap95 and, dark blue circles are Kap121. E, calculated Kdsingle needed to reproduce the experimental affinities for different values of N and Beff (red line, Beff = 150 mm; black line, Beff = 1 mm), showing that our model is quantitatively but not qualitatively dependent on the choice of this parameter. F, calculated values of Kdsingle required to reproduce the experimental data for N = 3 at different values for Beff.

