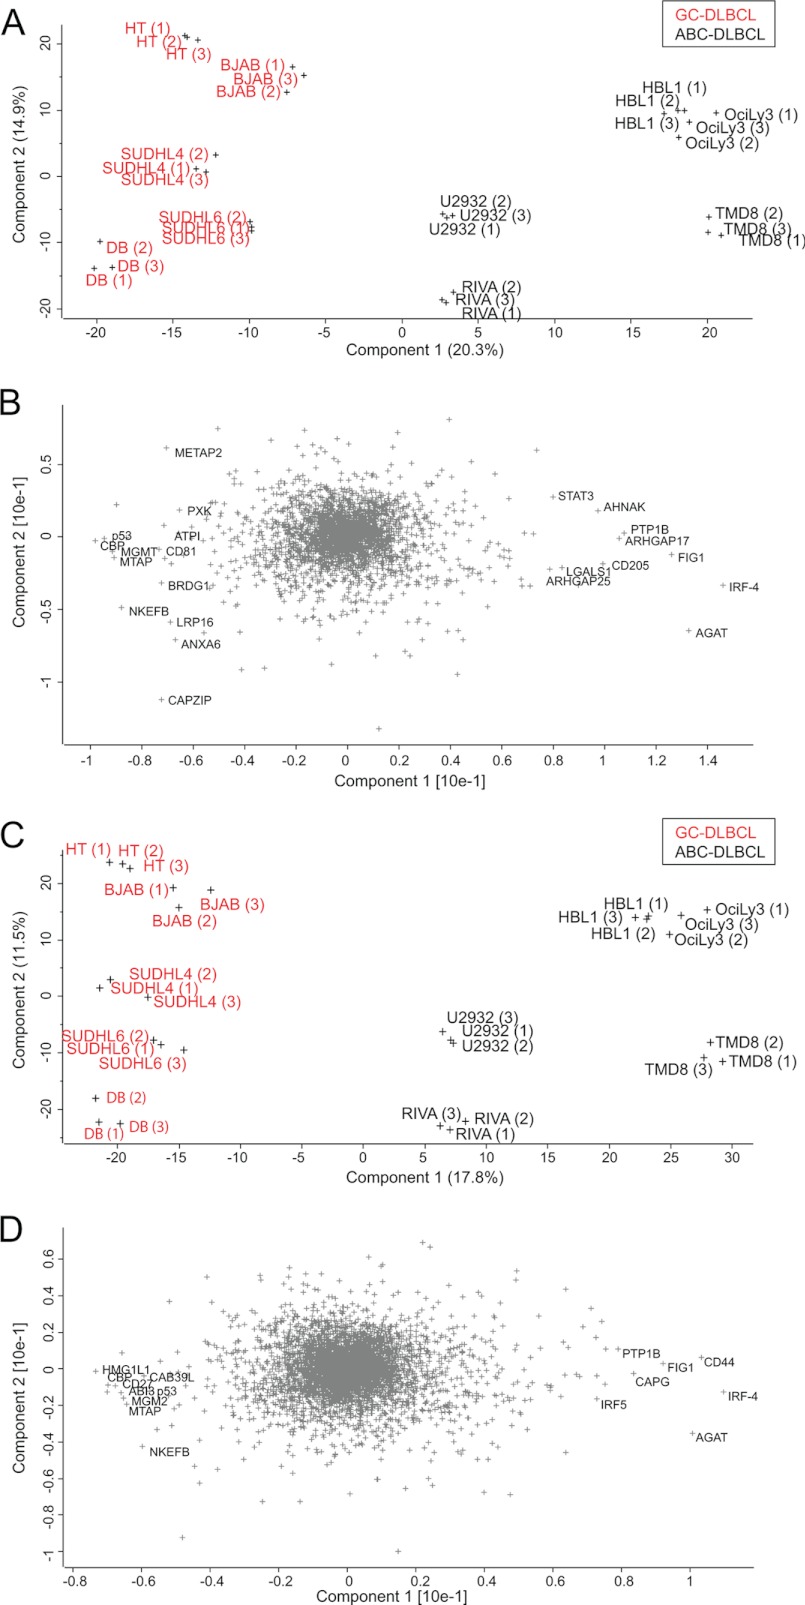
Fig. 4.
Principal component analysis. A, the proteomes of 10 DLBCL cell lines measured in triplicate segregated into ABC-DLBCL and GCB-DLBCL subtypes after filtering for 100% valid values (3,007 proteins). B, loadings of A reveal proteins that strongly drive the segregation in PCA component 1. C, the same analysis as in A but after filtering for 50% valid values (4,991 proteins) and filling the missing values by data imputation results in even stronger separation. D, loadings of C uncover additional known and unknown markers that segregate the ABC and GCB subtypes.

