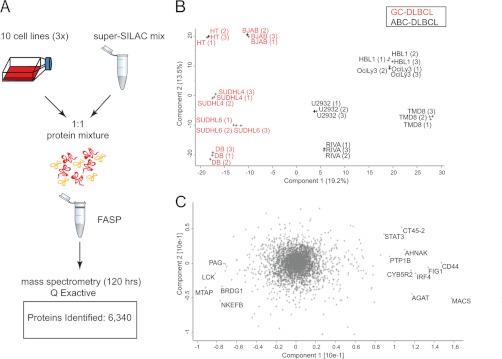
Fig. 7.
Single-shot proteome measurements to distinguish ABC from GCB. A, unfractionated, FASP-processed peptide mixtures were directly loaded onto a relatively long column (50 cm) after StageTipping. The proteomes were analyzed in triplicates in 4-h runs by an UHPLC (EASY nLC 1000) system coupled to a benchtop quadrupole Orbitrap mass spectrometer (Q Exactive). B, principal component analysis of the single-shot measurements. C, loadings of PCA in B highlighting the proteins that strongly drive the segregation in PCA component 1.

