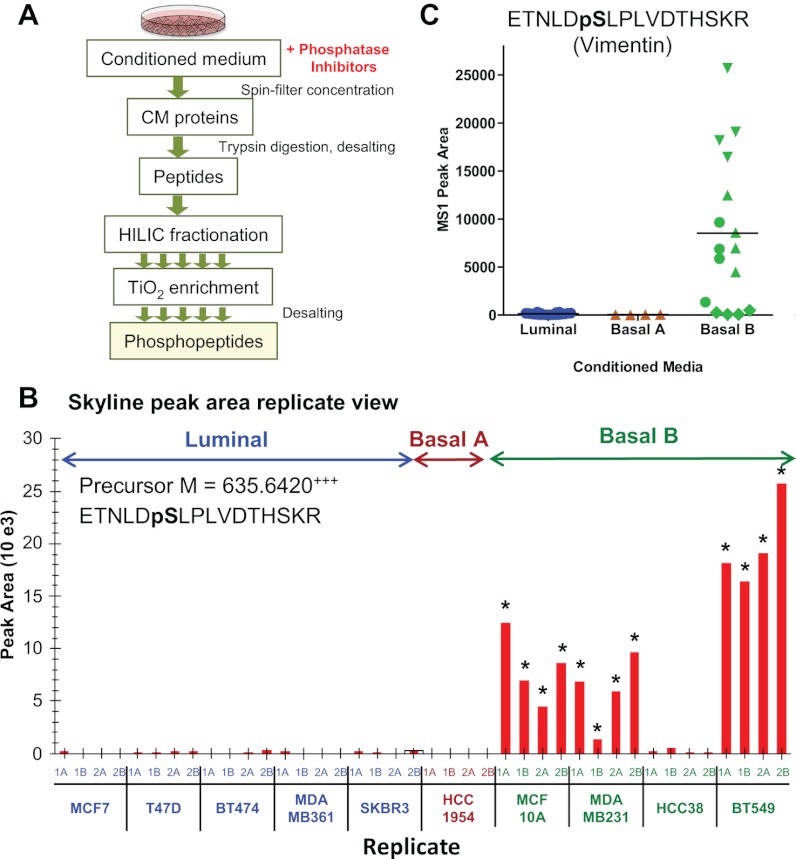
Fig. 6.
Relative quantitation of phosphopeptides from conditioned media from subtype specific breast cancer cell lines. A, workflow for phosphopeptide enrichment from CM, including hydrophilic interaction liquid chromatography separation steps prior to TiO2 phosphopeptide enrichment and subsequent LC-MS/MS analysis. B, Skyline peak area replicate view of phosphopeptide, ETNLDpSLPLVDTHSKR, derived from vimentin and extracted by precursor ion M at m/z 635.642. The peak was monitored for CM from five luminal, one basal A, and four basal B cancer cell lines (two biological and two injection replicates each) with measured peak area means at 126, 33, and 8538, respectively. The asterisks at individual replicates indicate sampling of an MS/MS and identification of the phosphopeptide. C, plot of MS1 filtered peak areas clustered by breast cancer subtype, with blue for luminal, brown for basal A, and green for basal B CM samples (two biological and two acquisition replicates per individual cell line maintain the same symbol).

